.svg)
Our products can help you optimize pricing, maximize procurement, increase supply chain efficiency, optimize sales and marketing plans, improve channel strategy, increase yield, reduce costs and mitigate impact on climate change.
.svg)
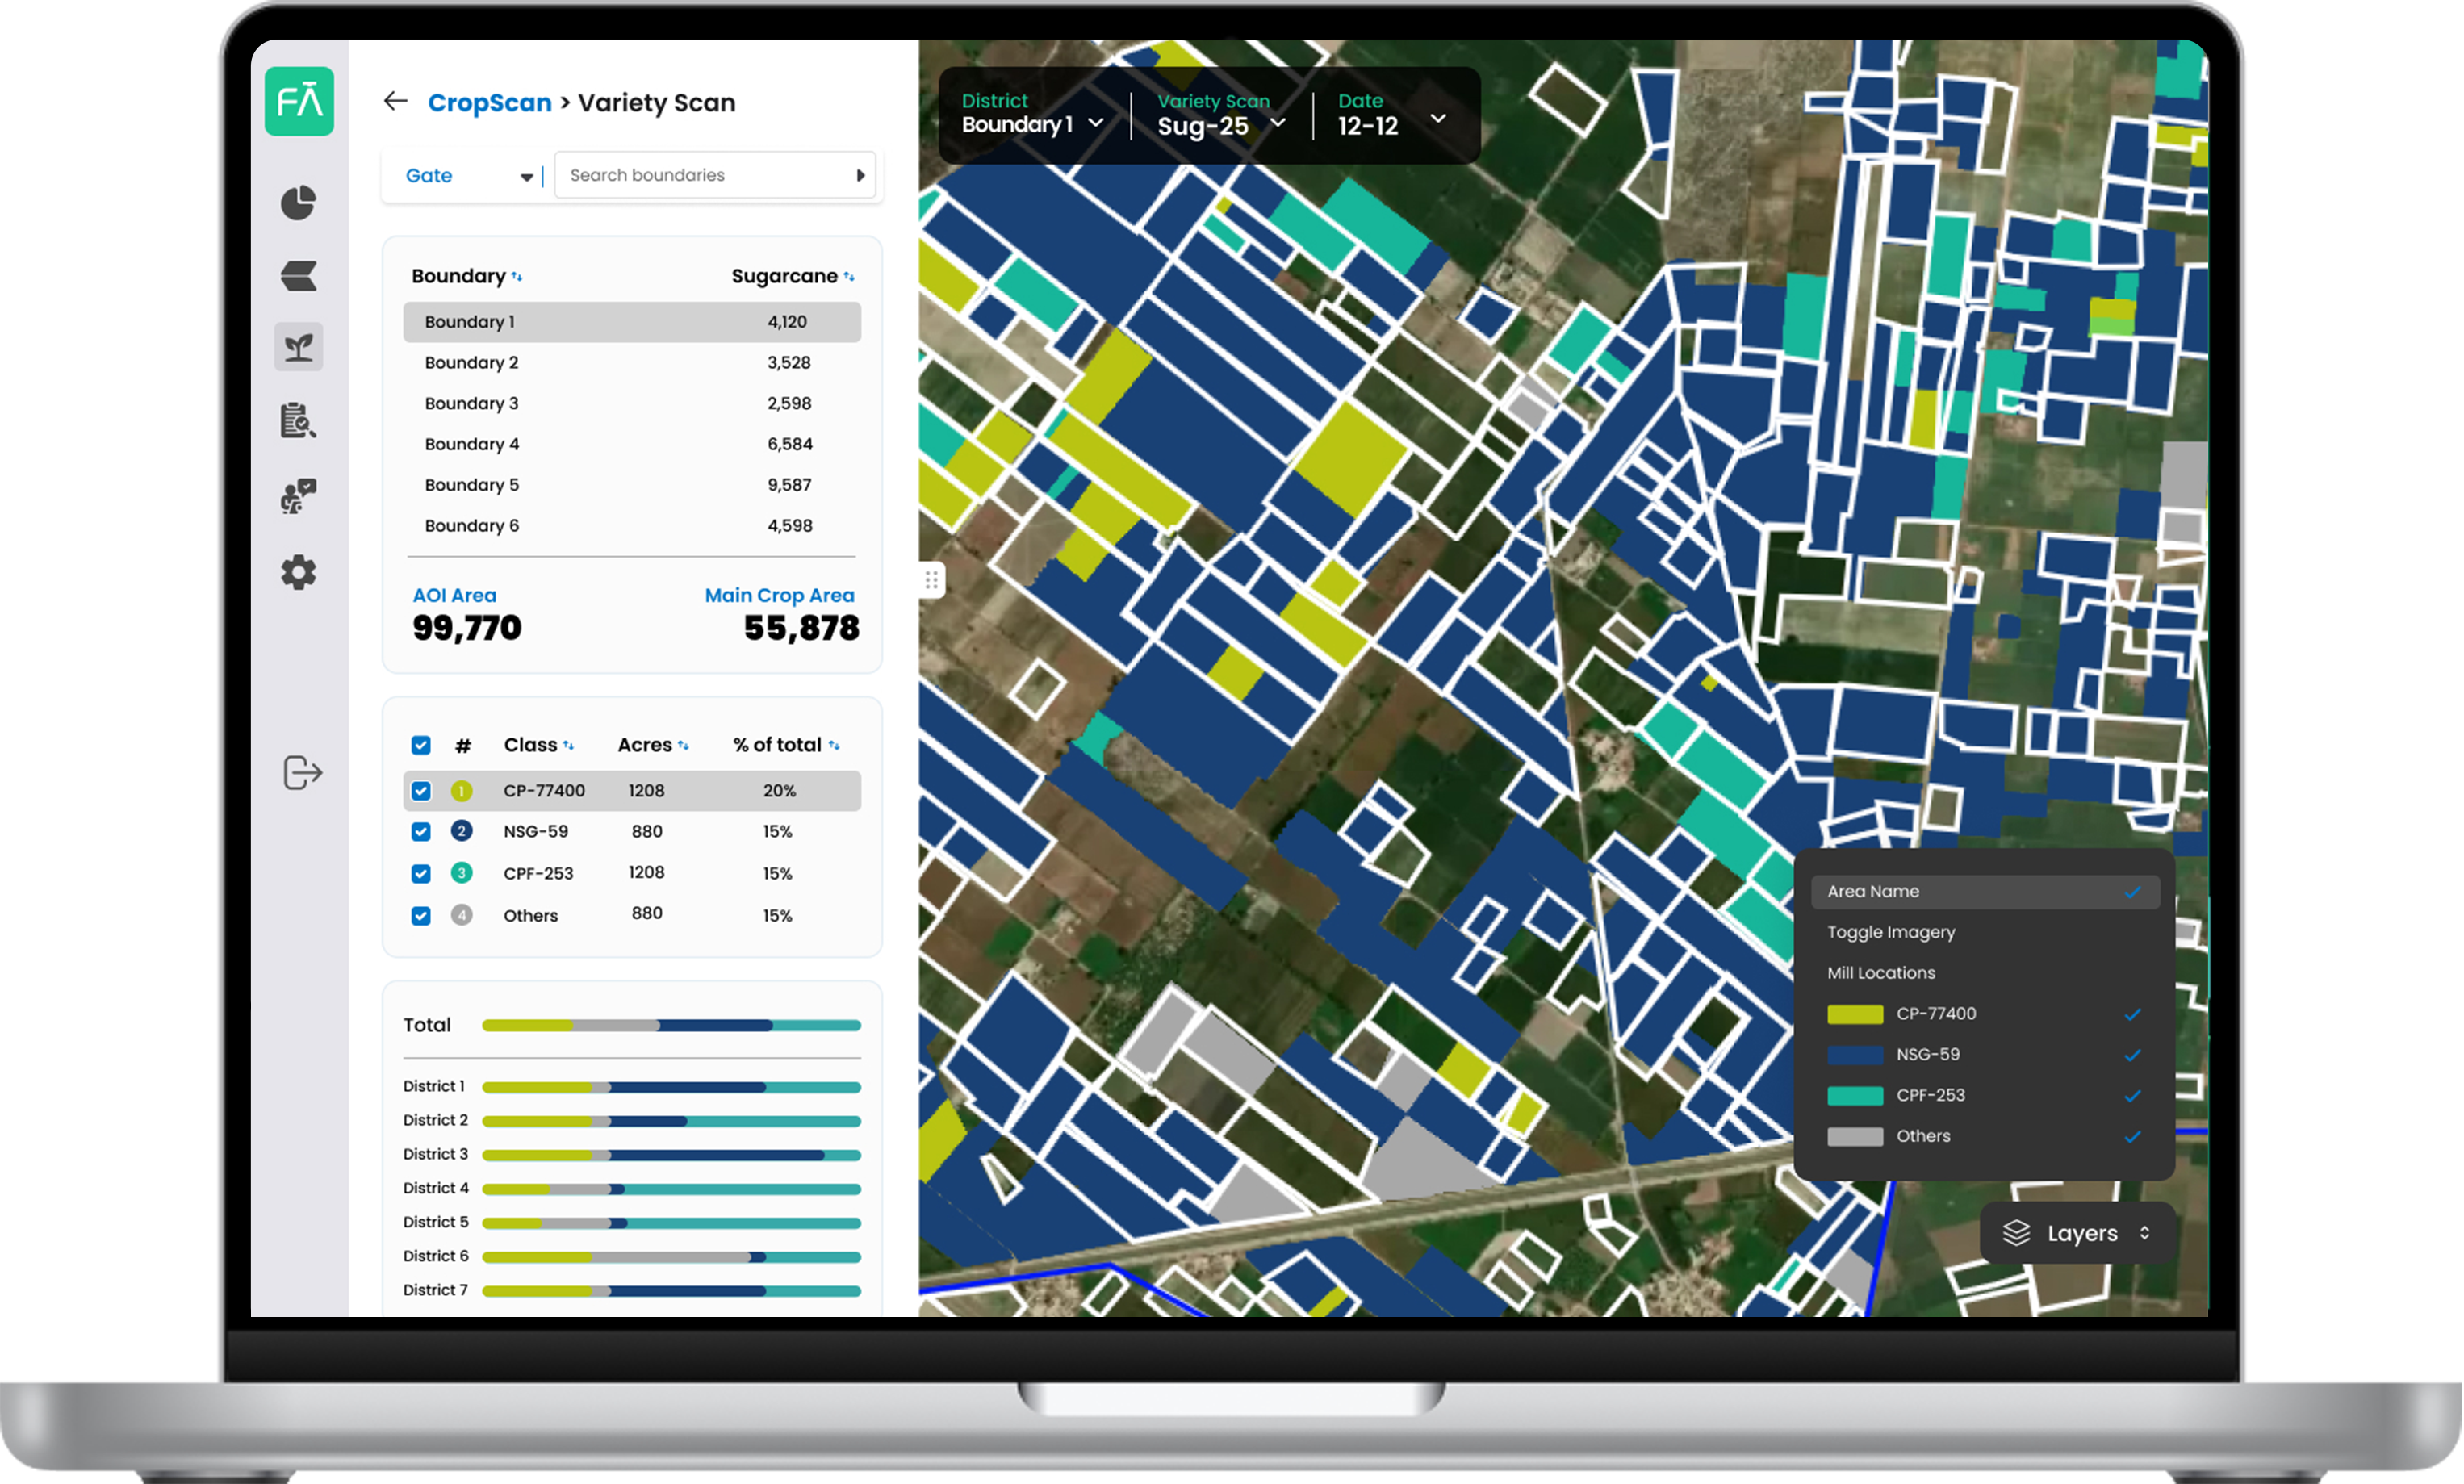
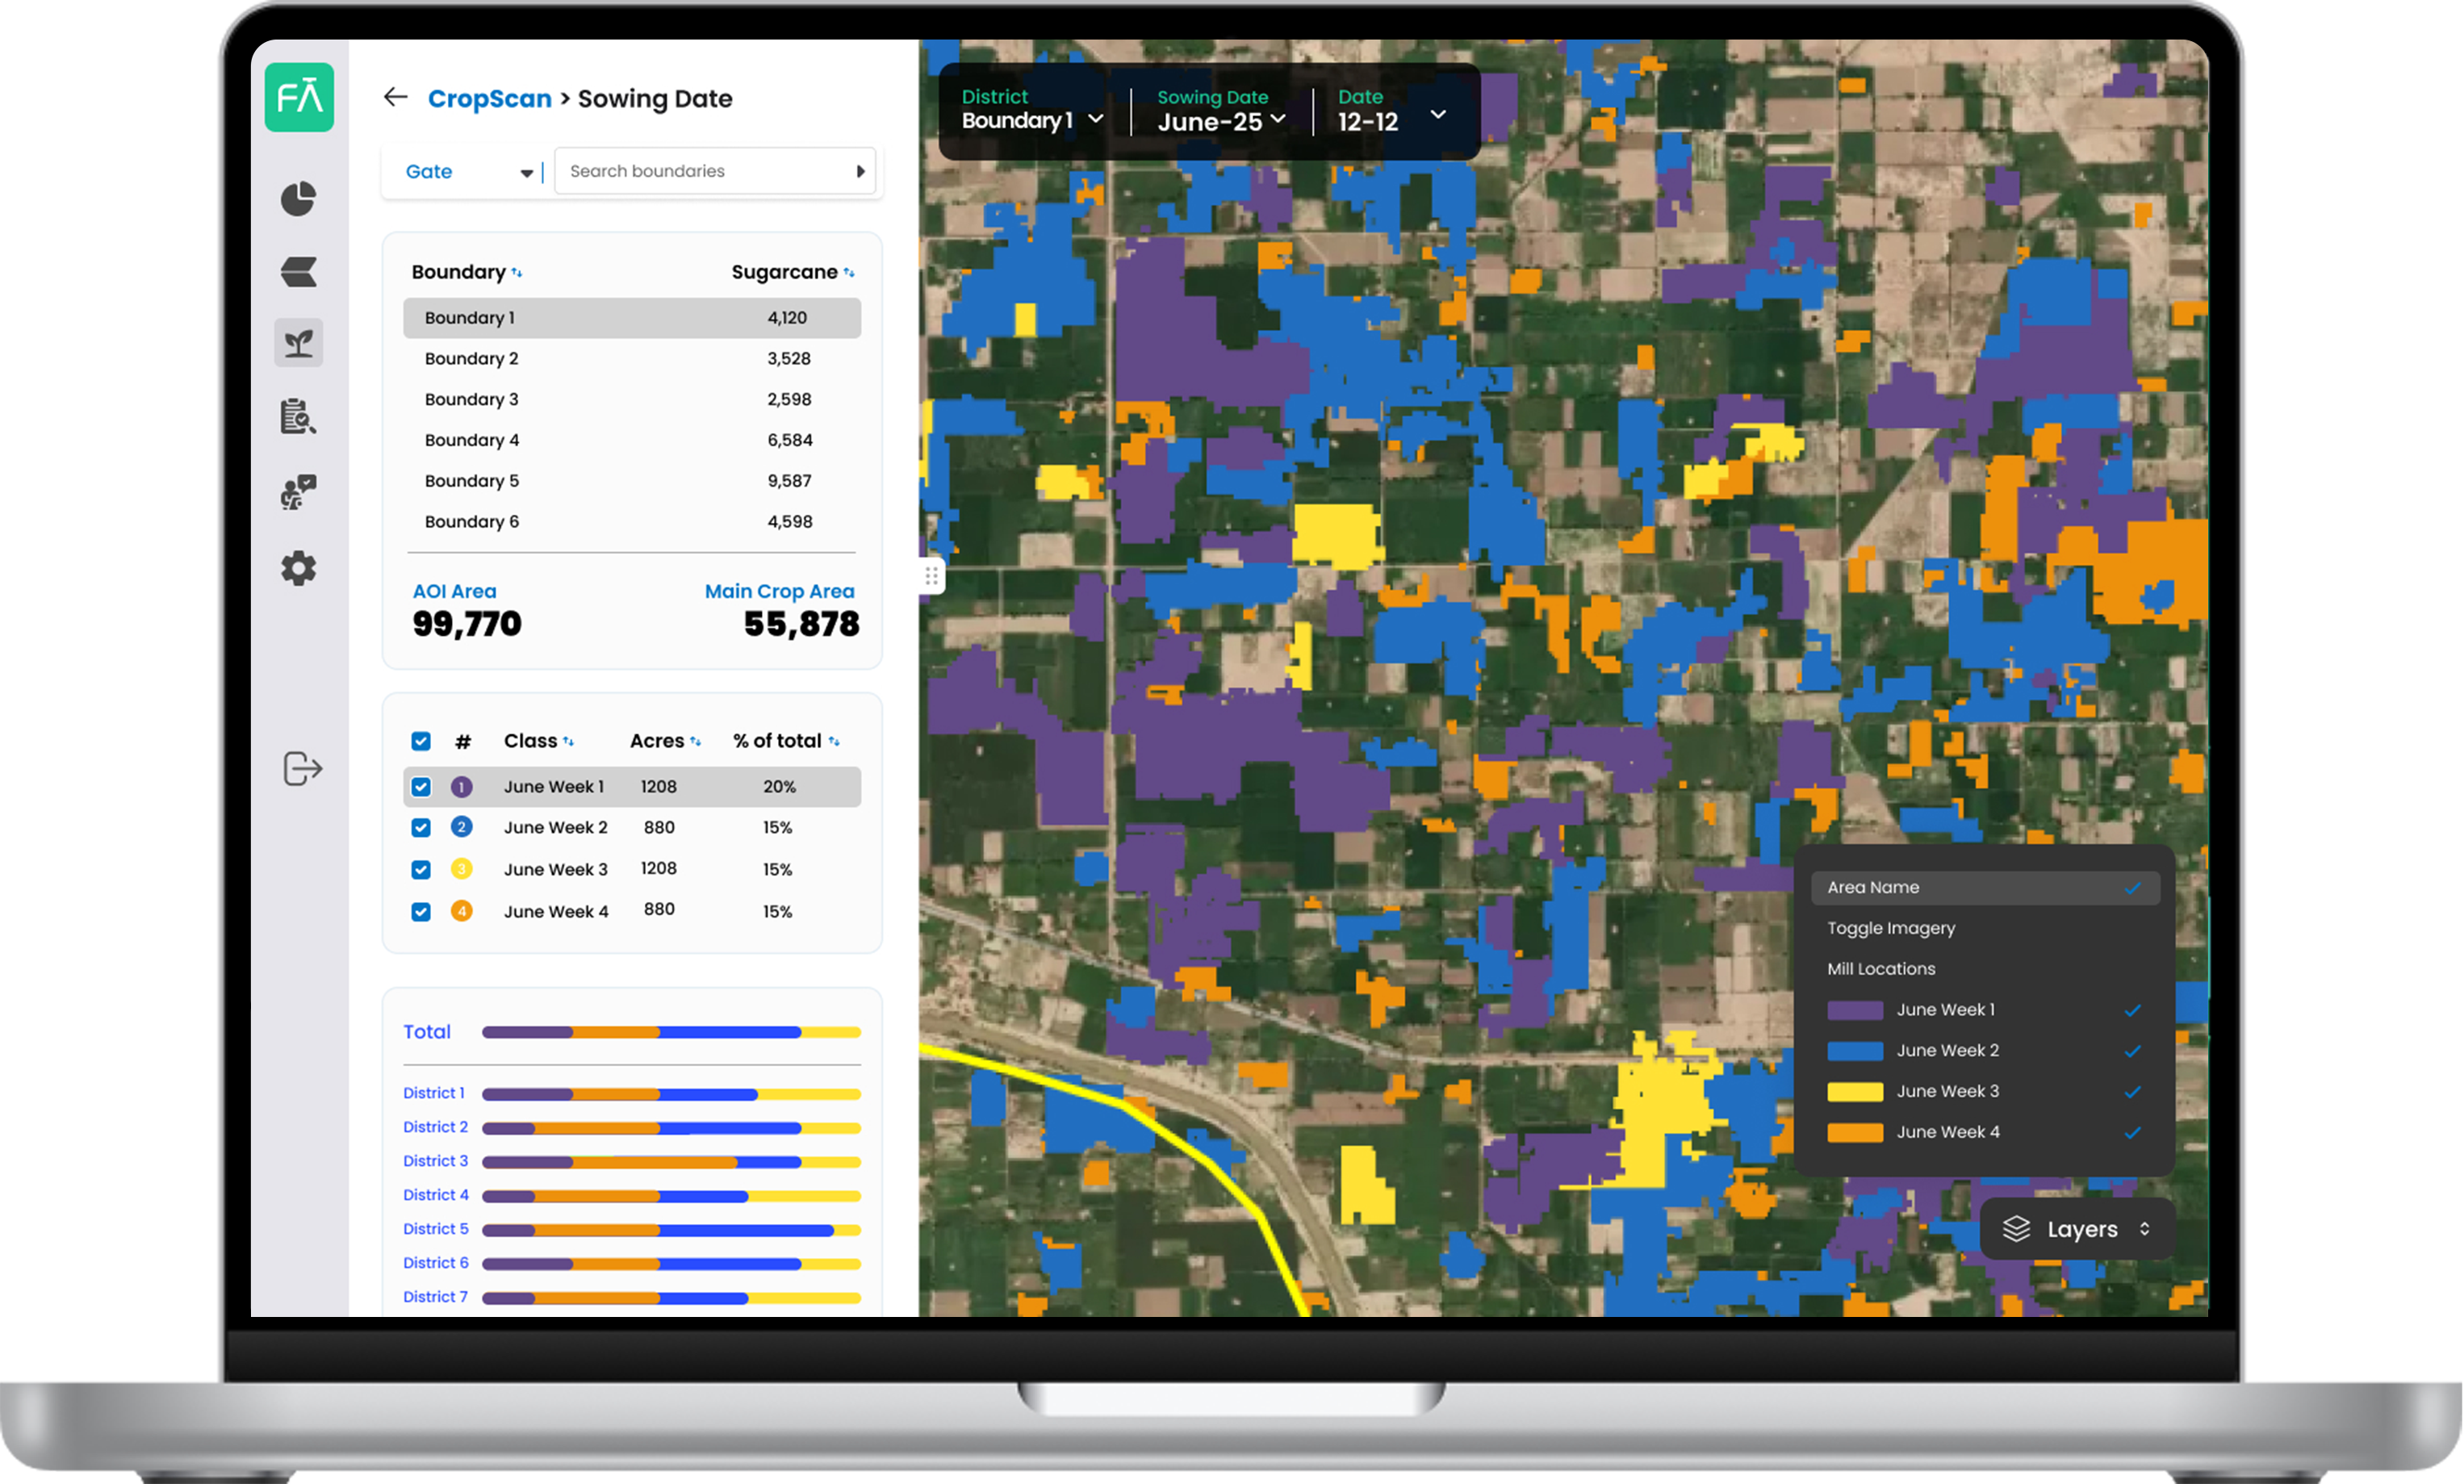
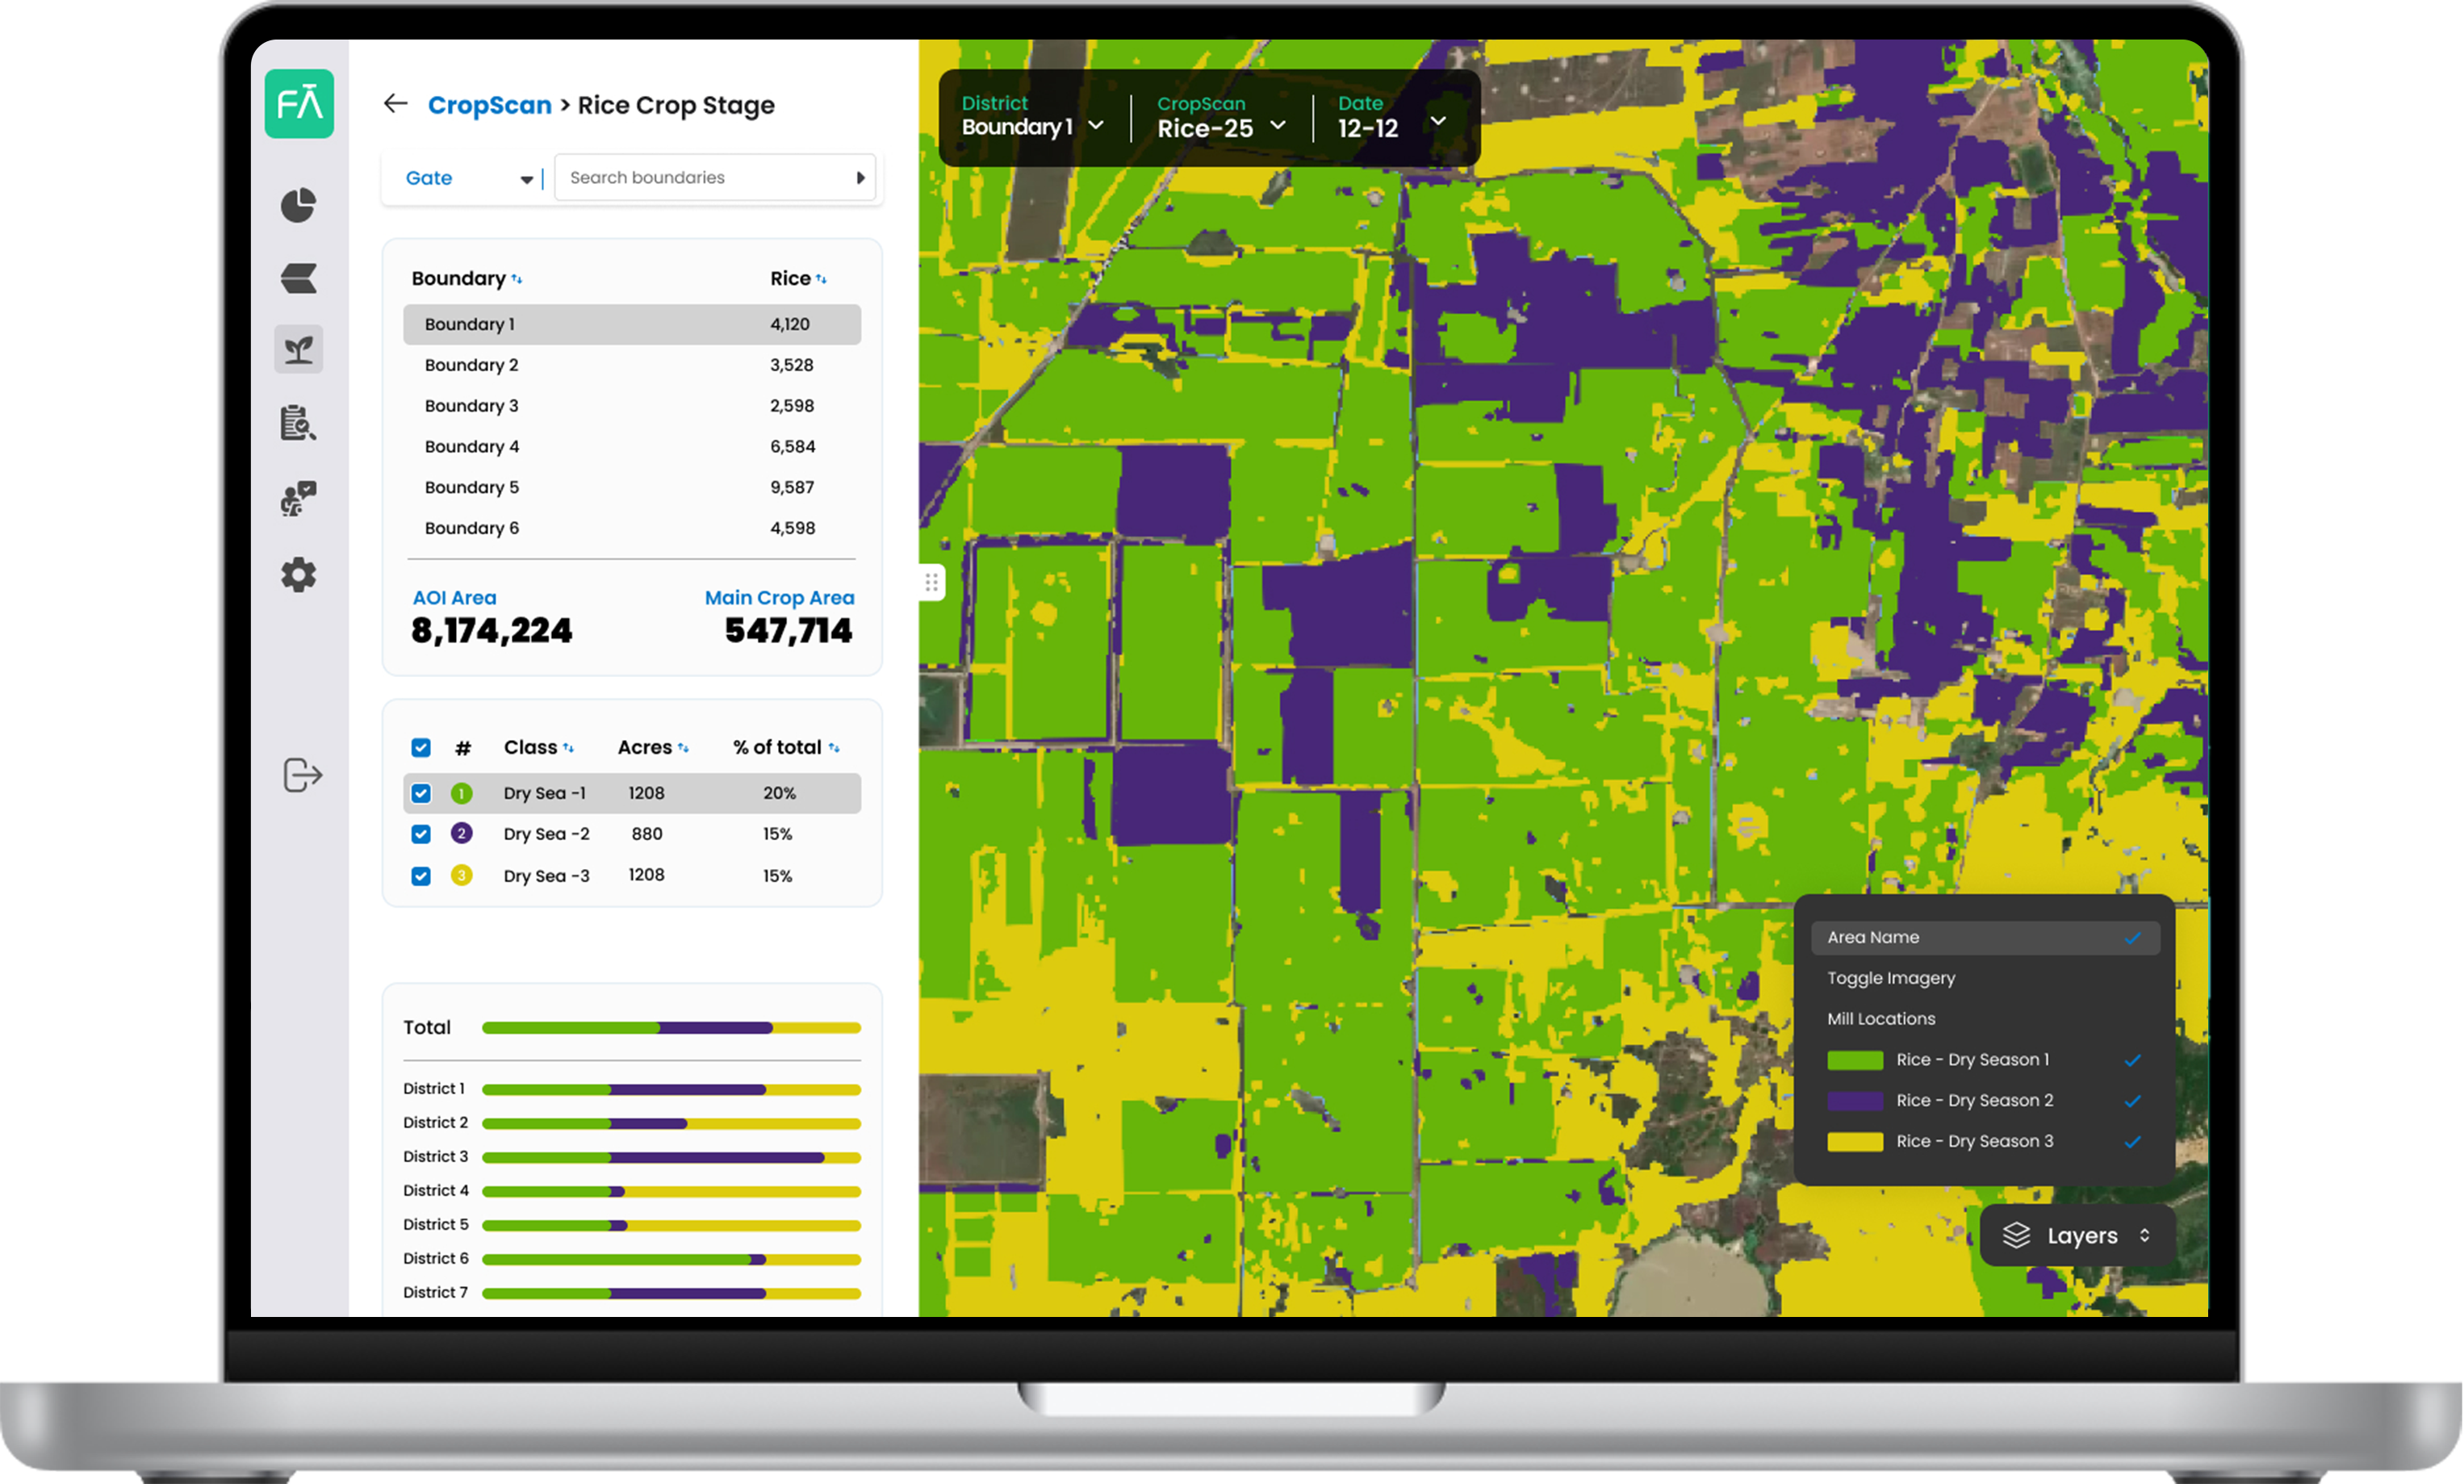
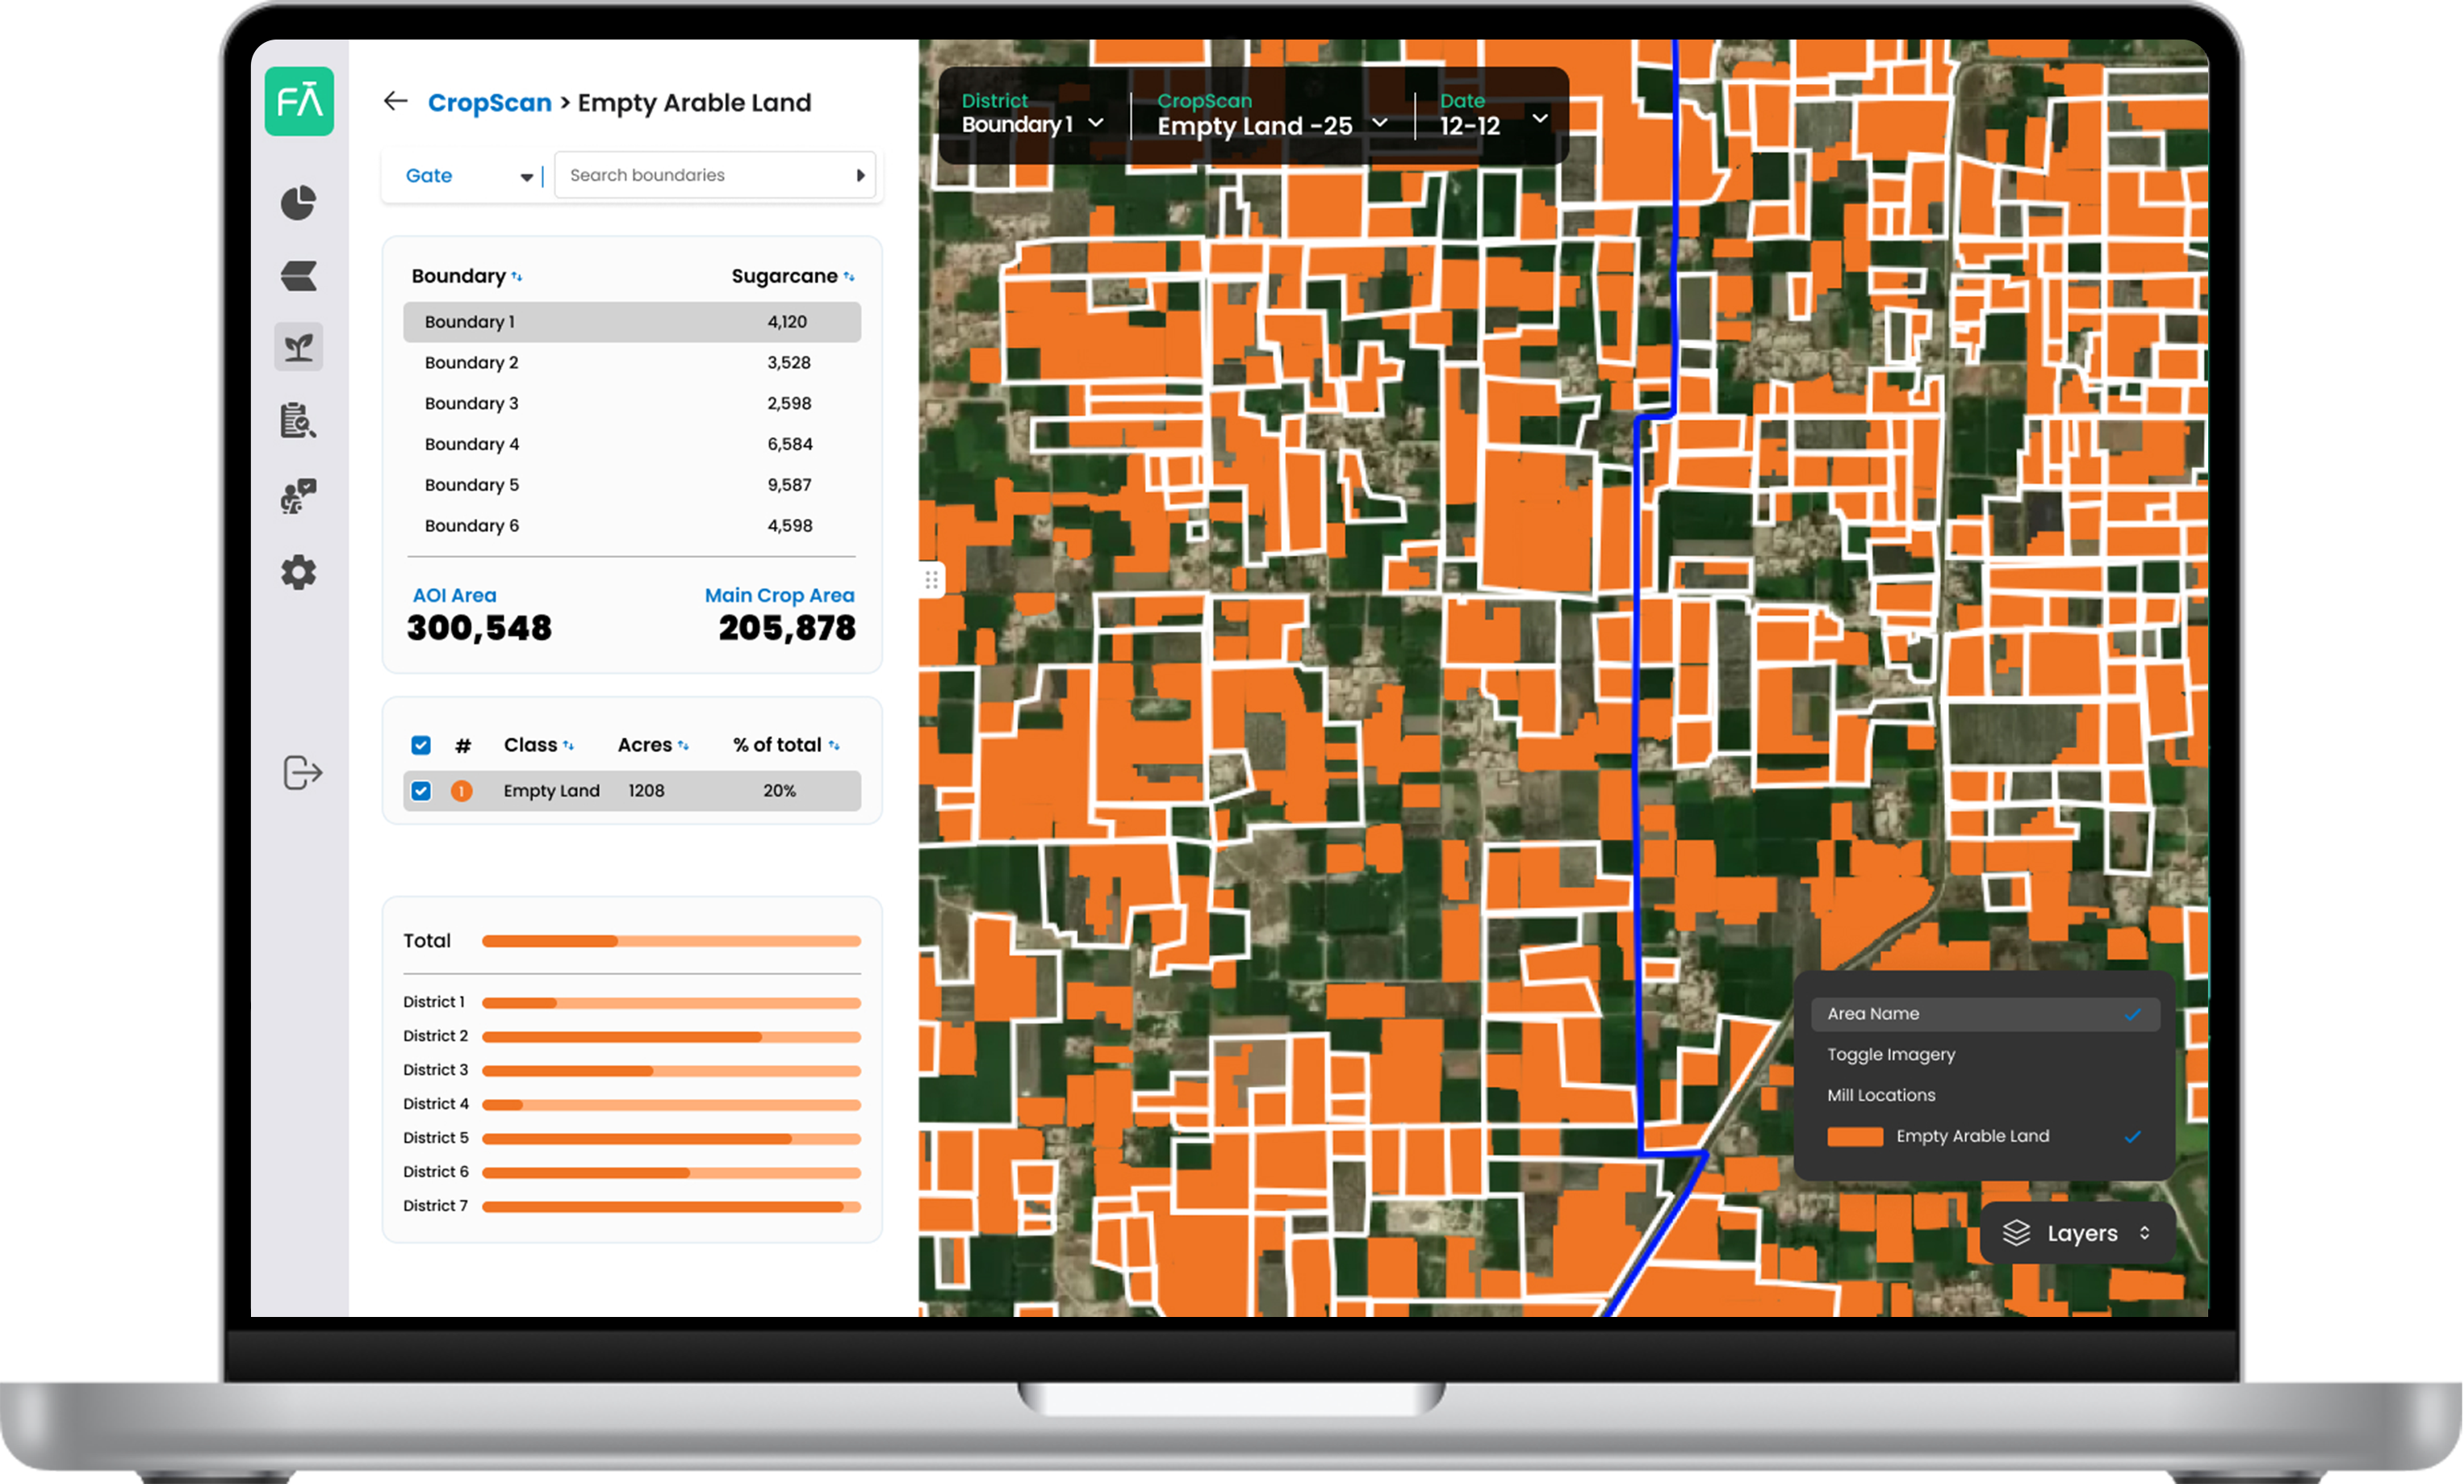
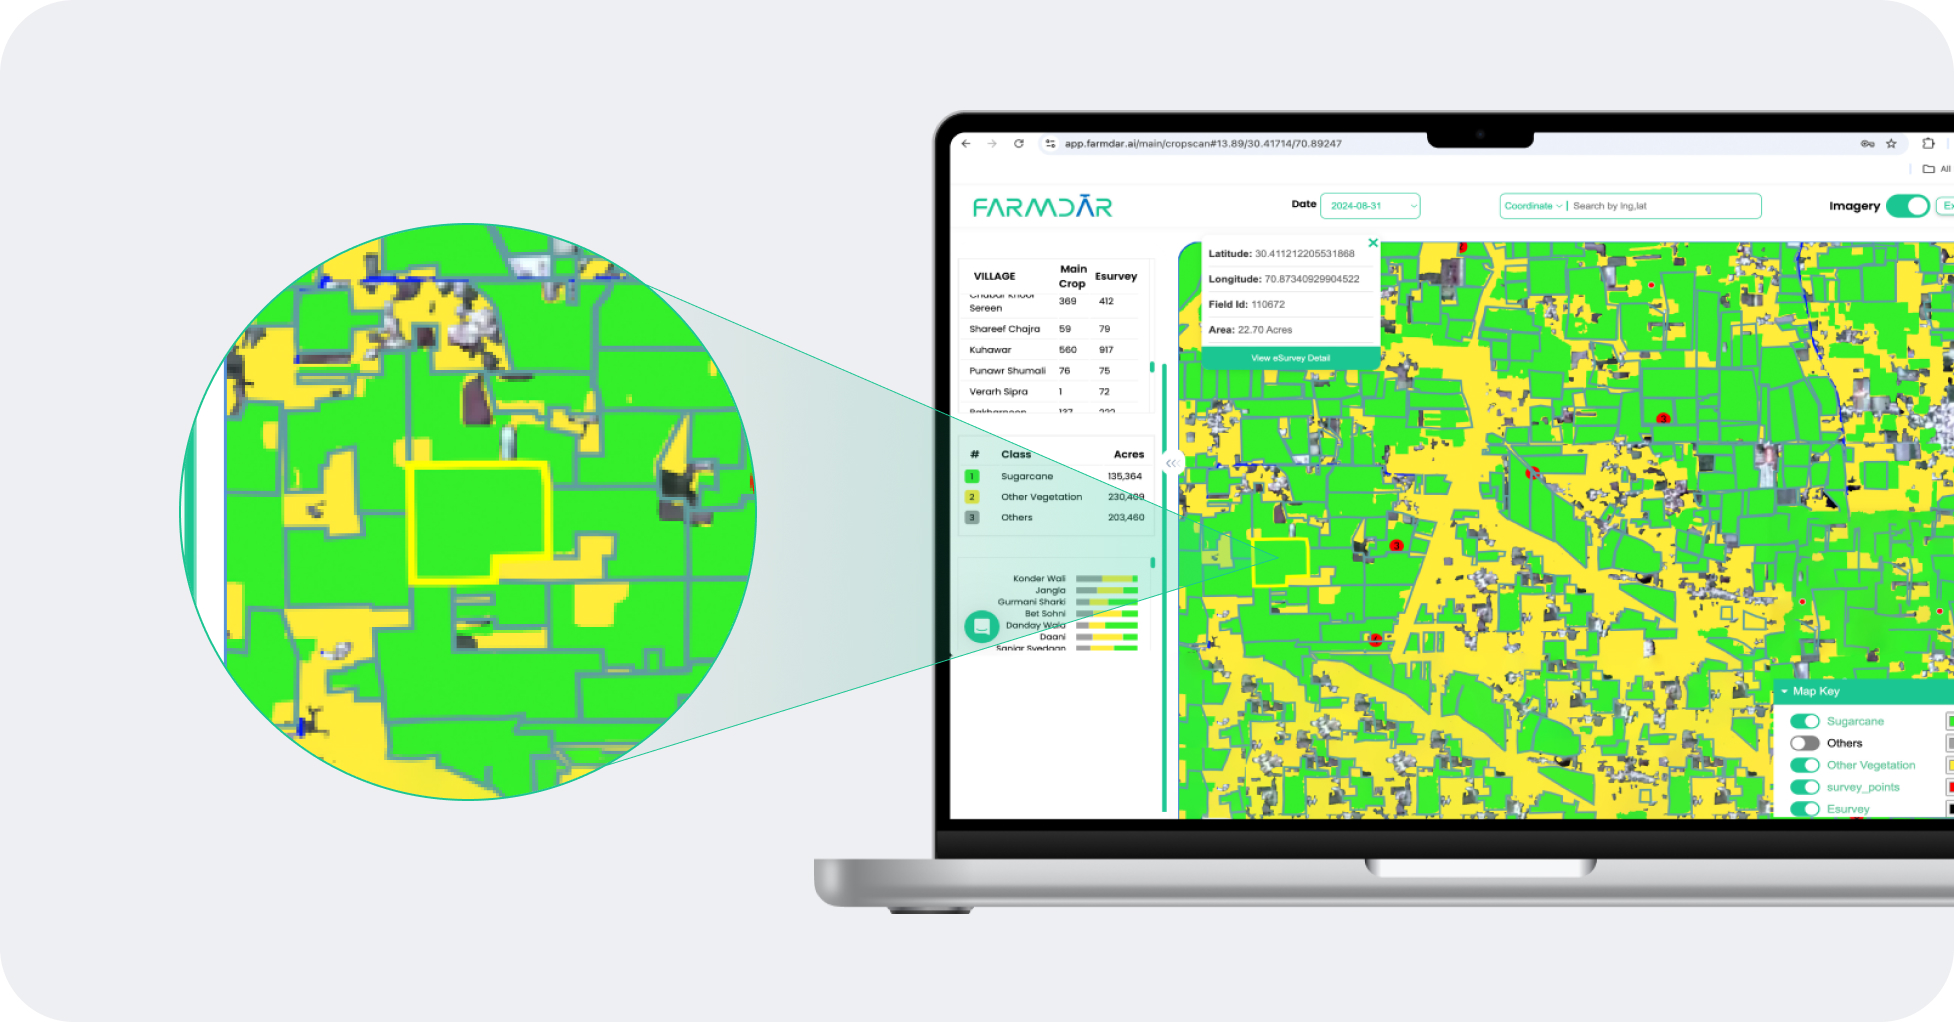
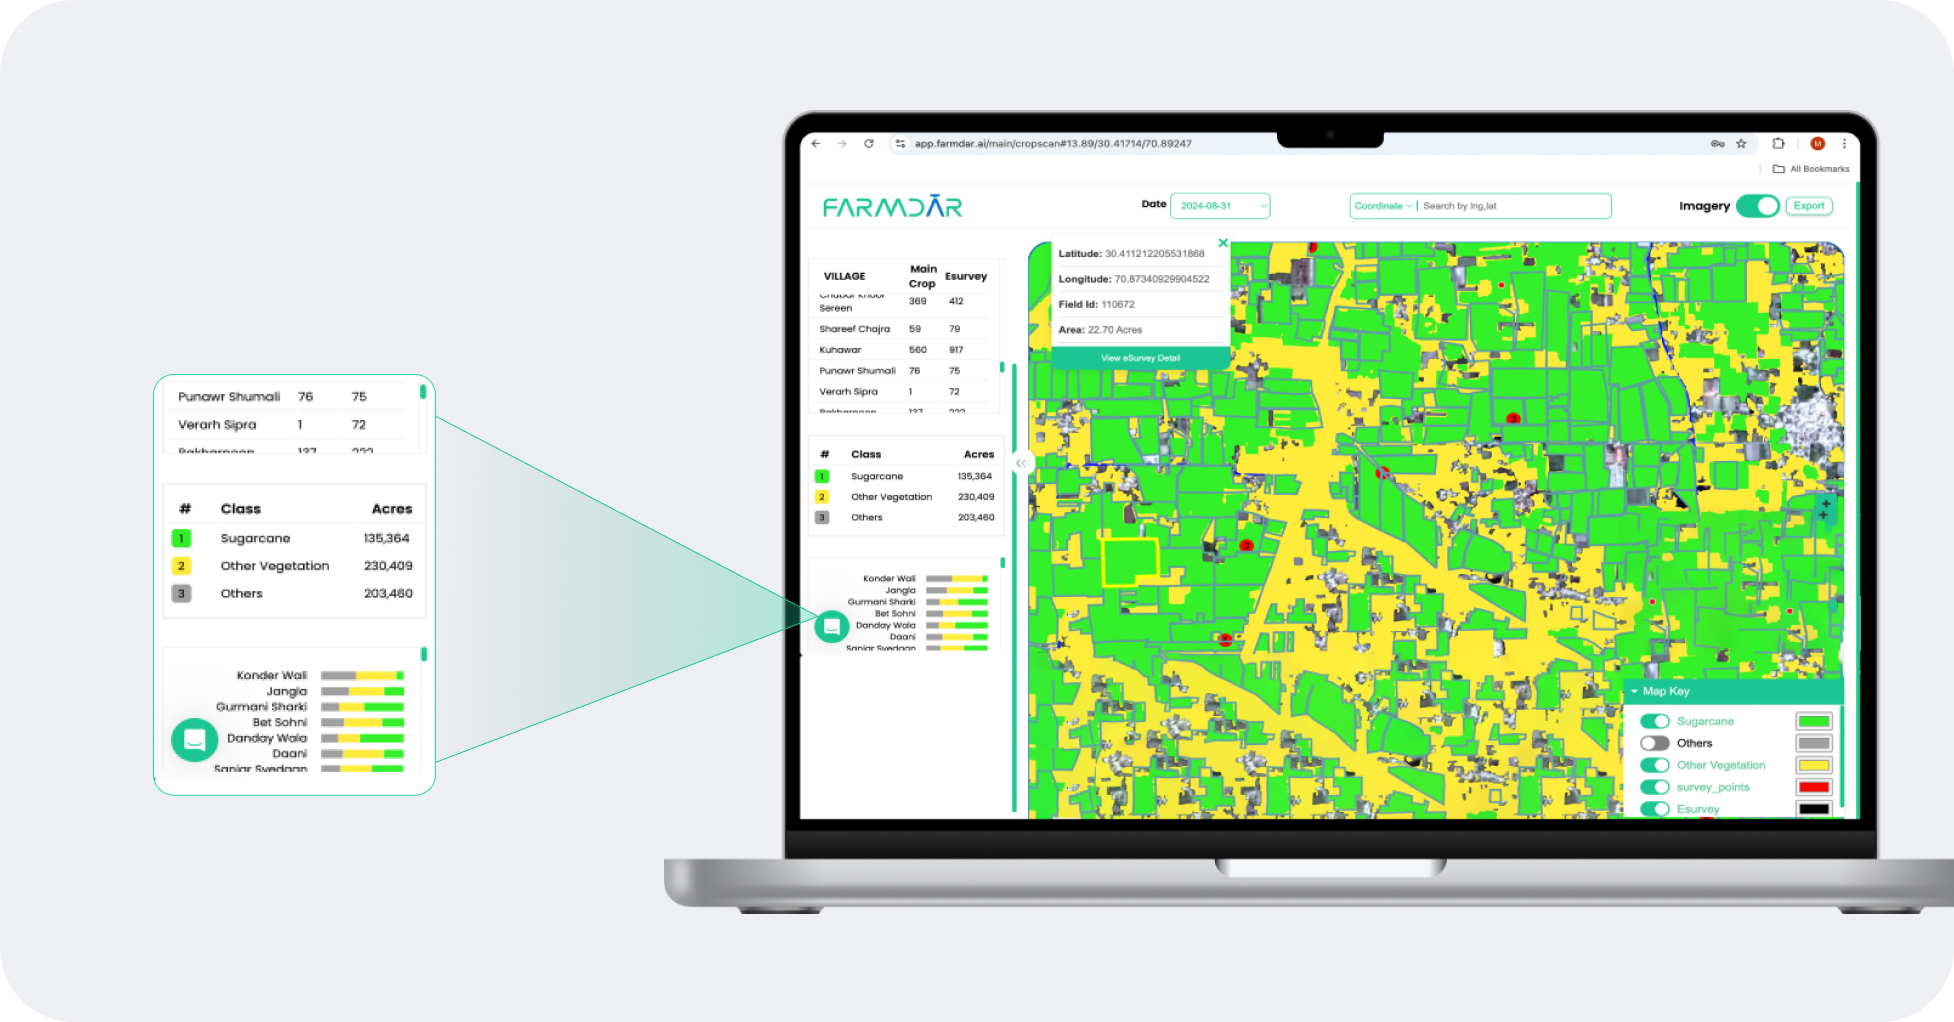
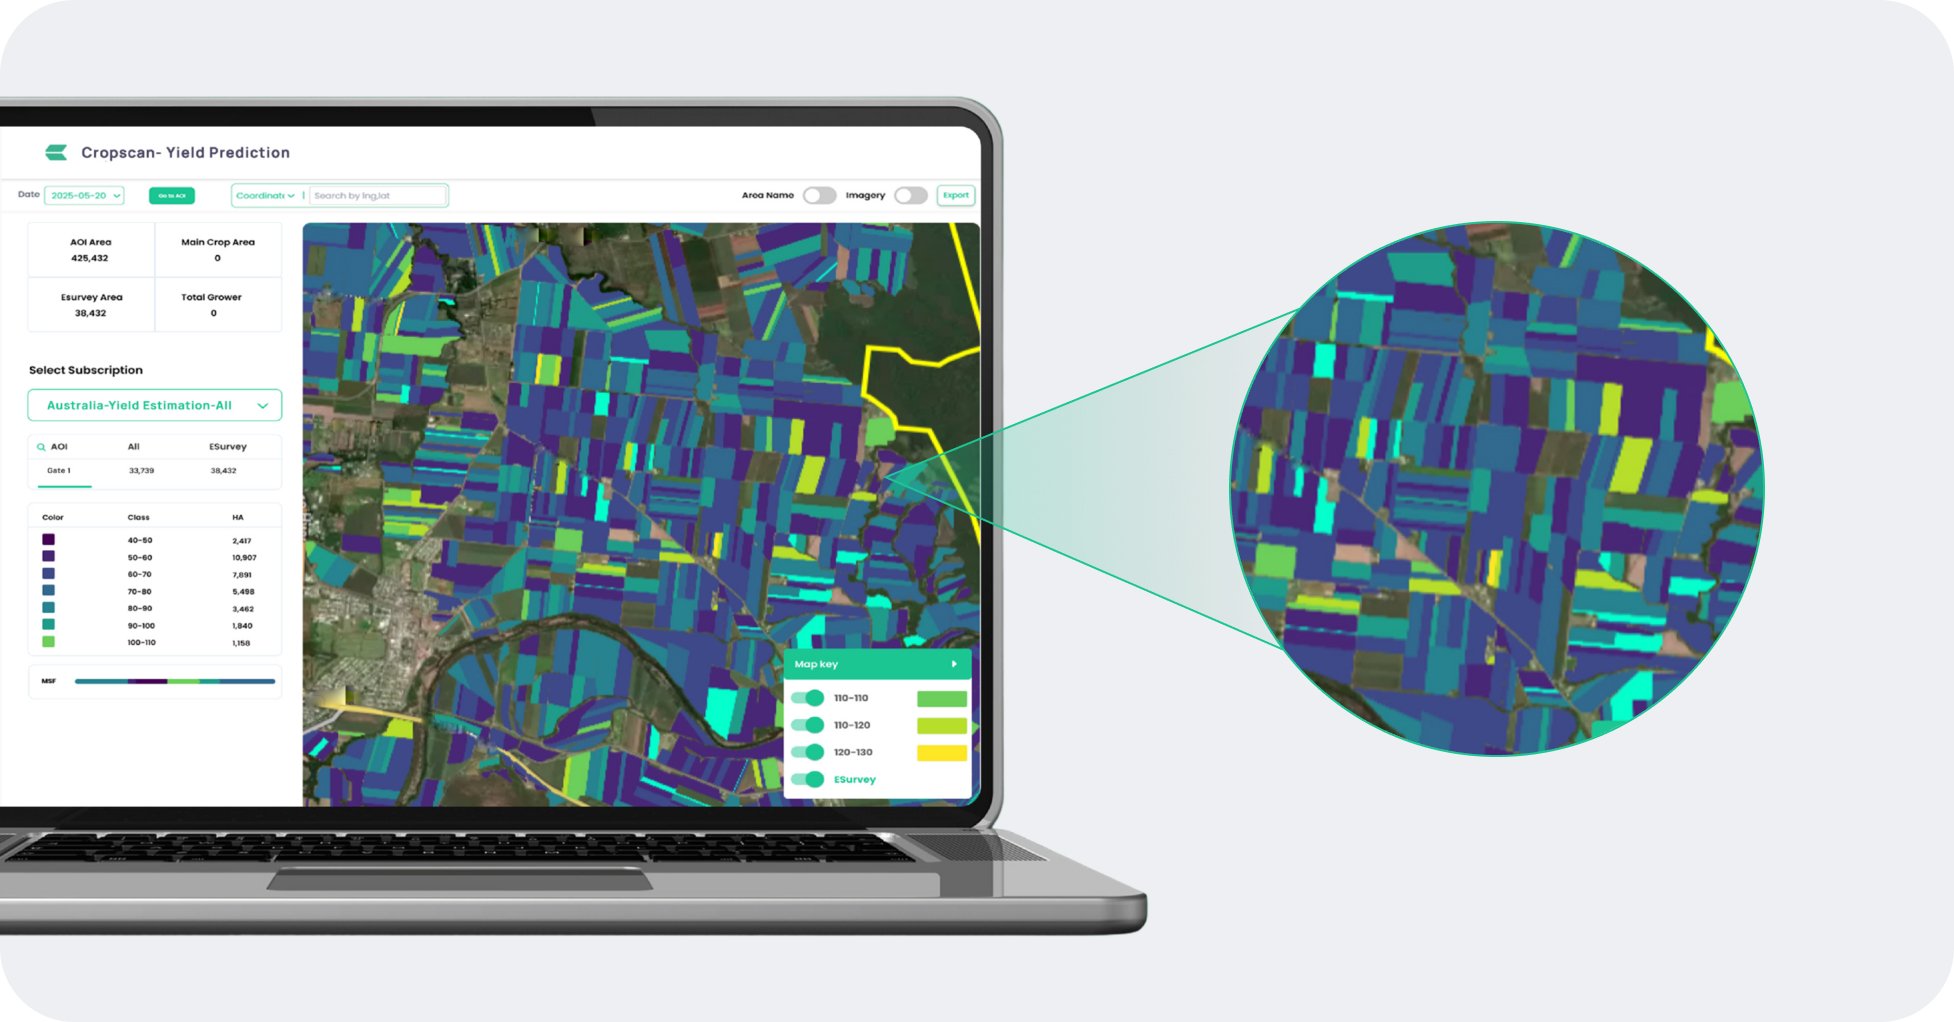
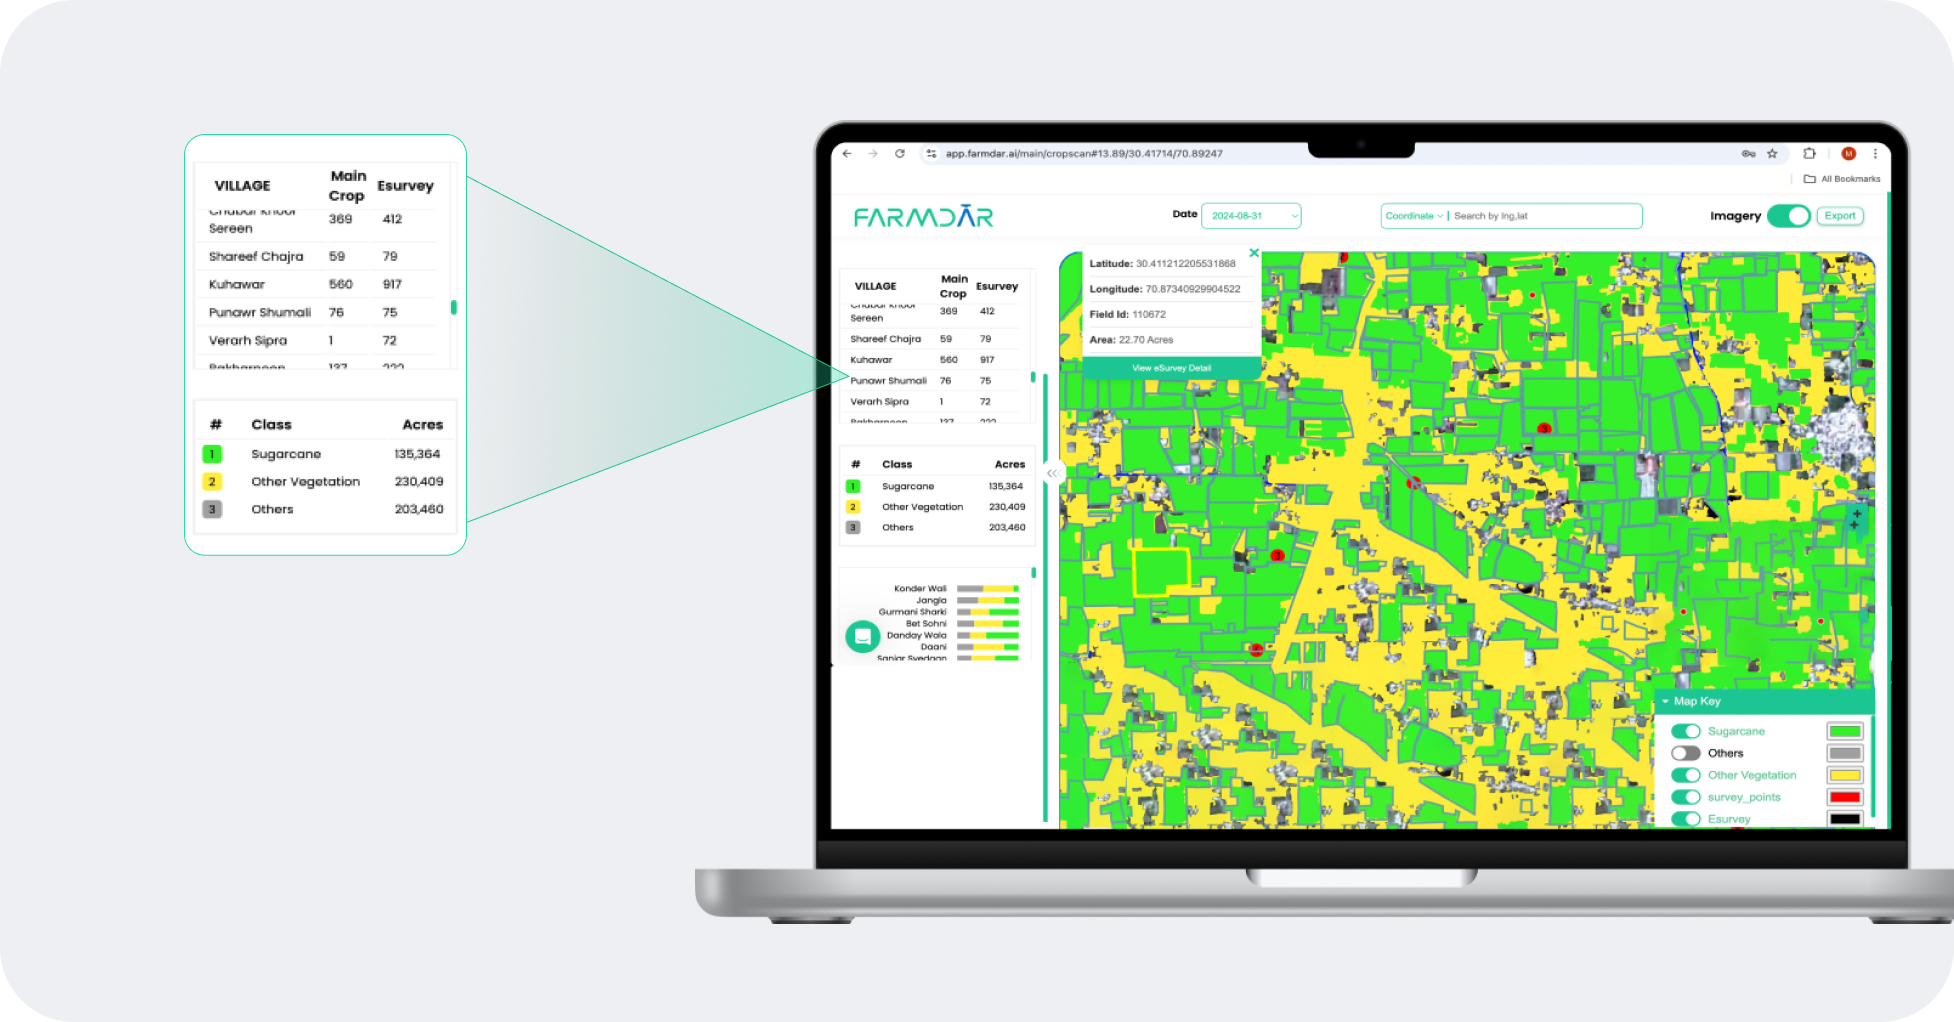
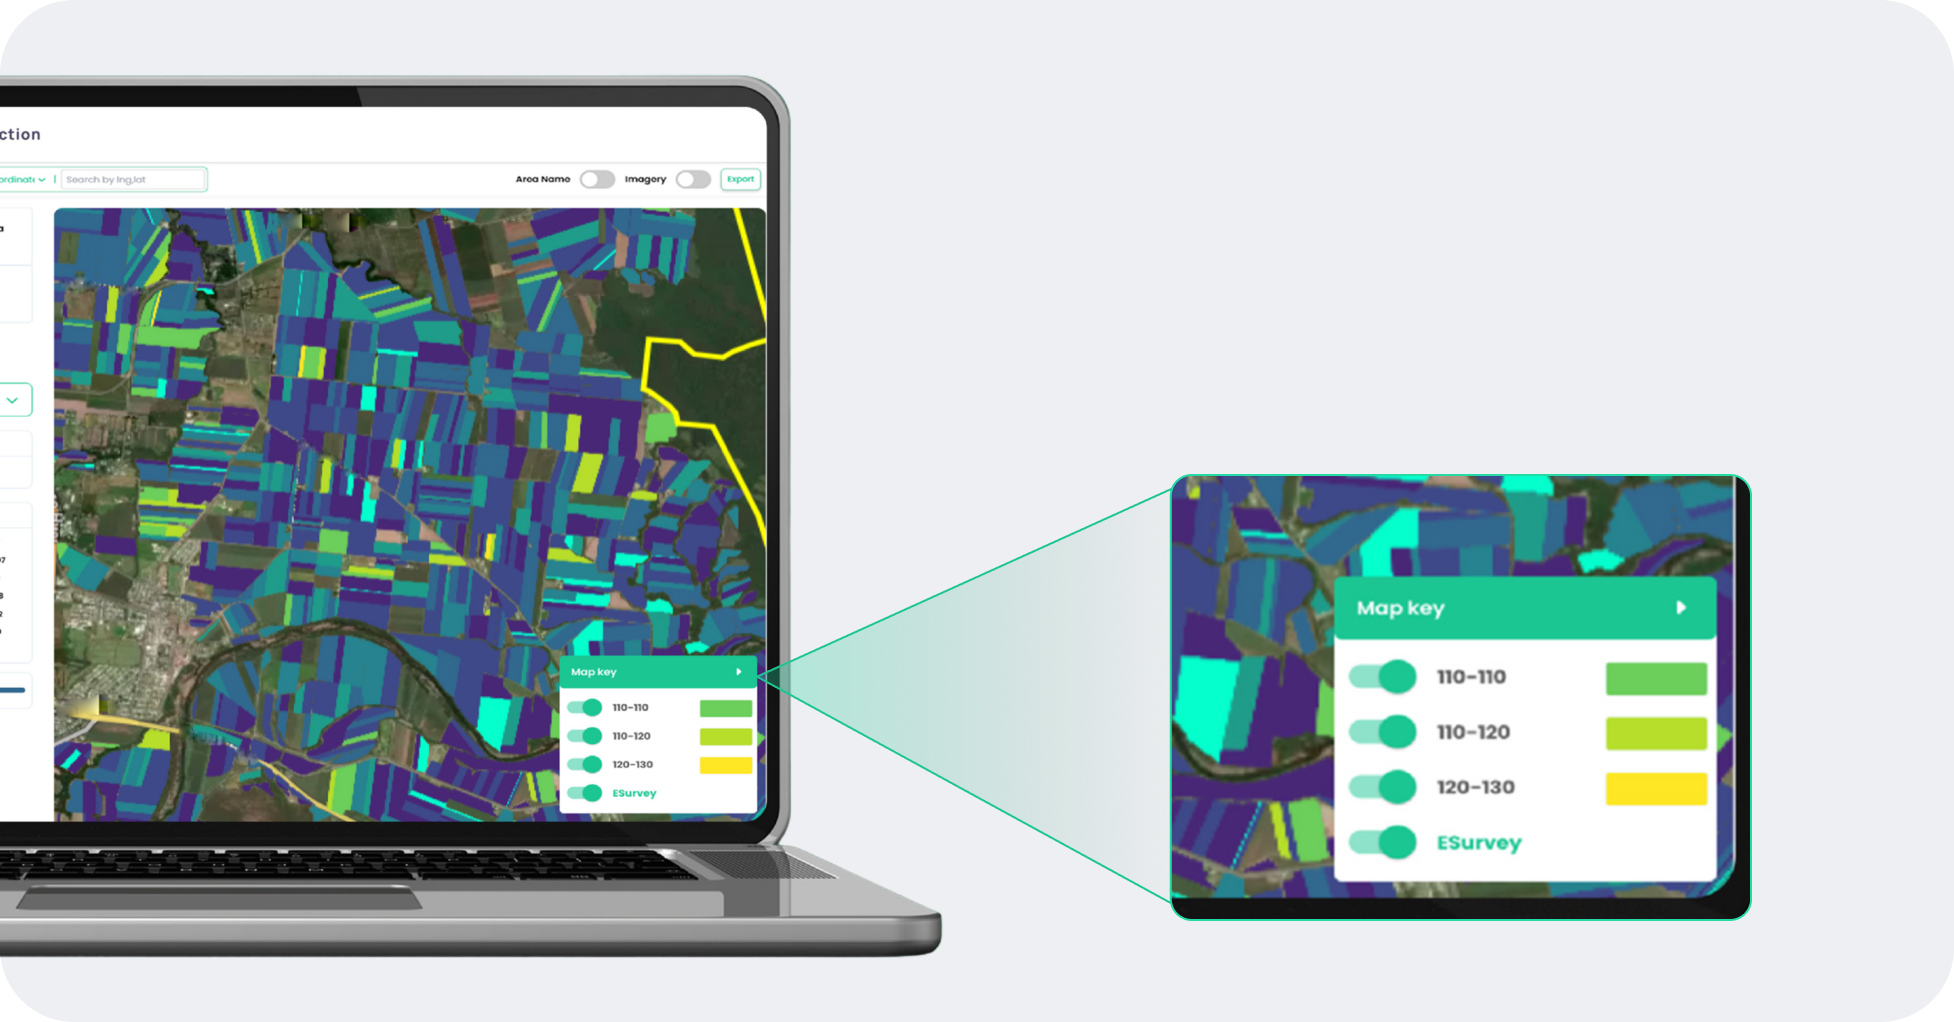
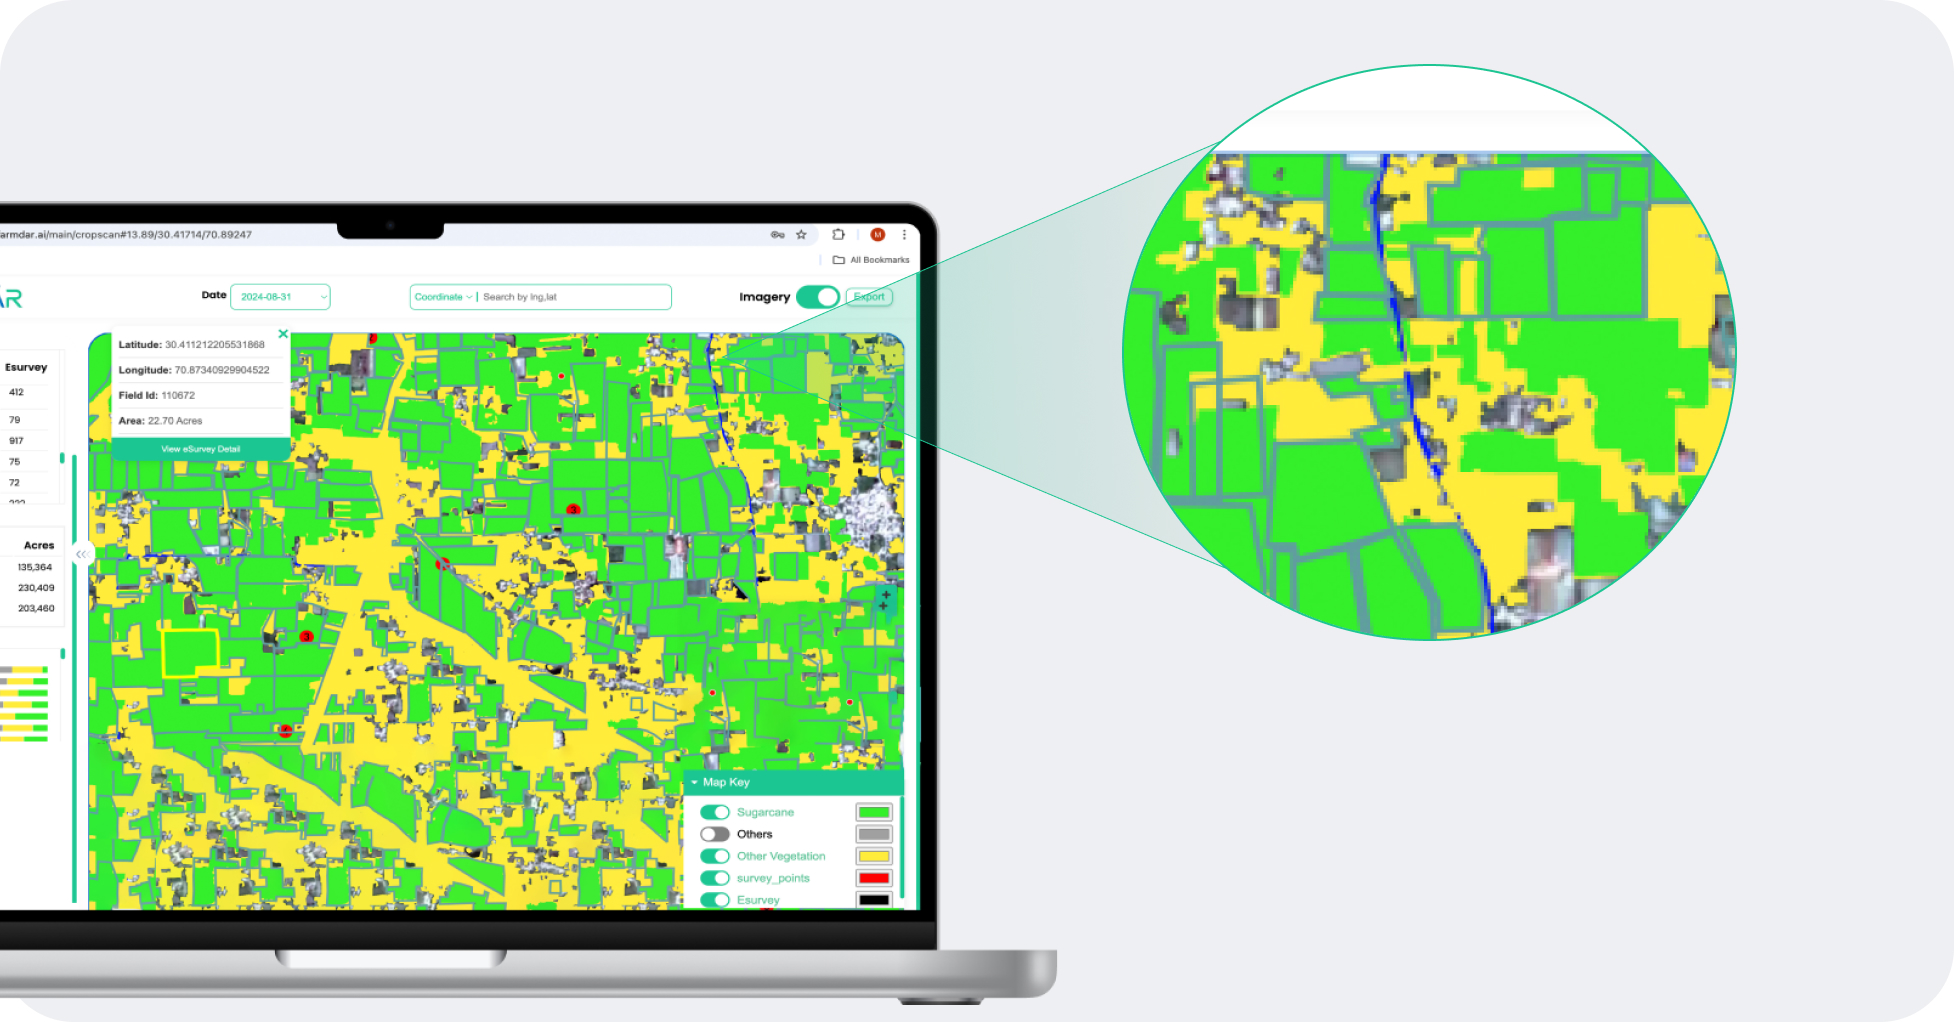
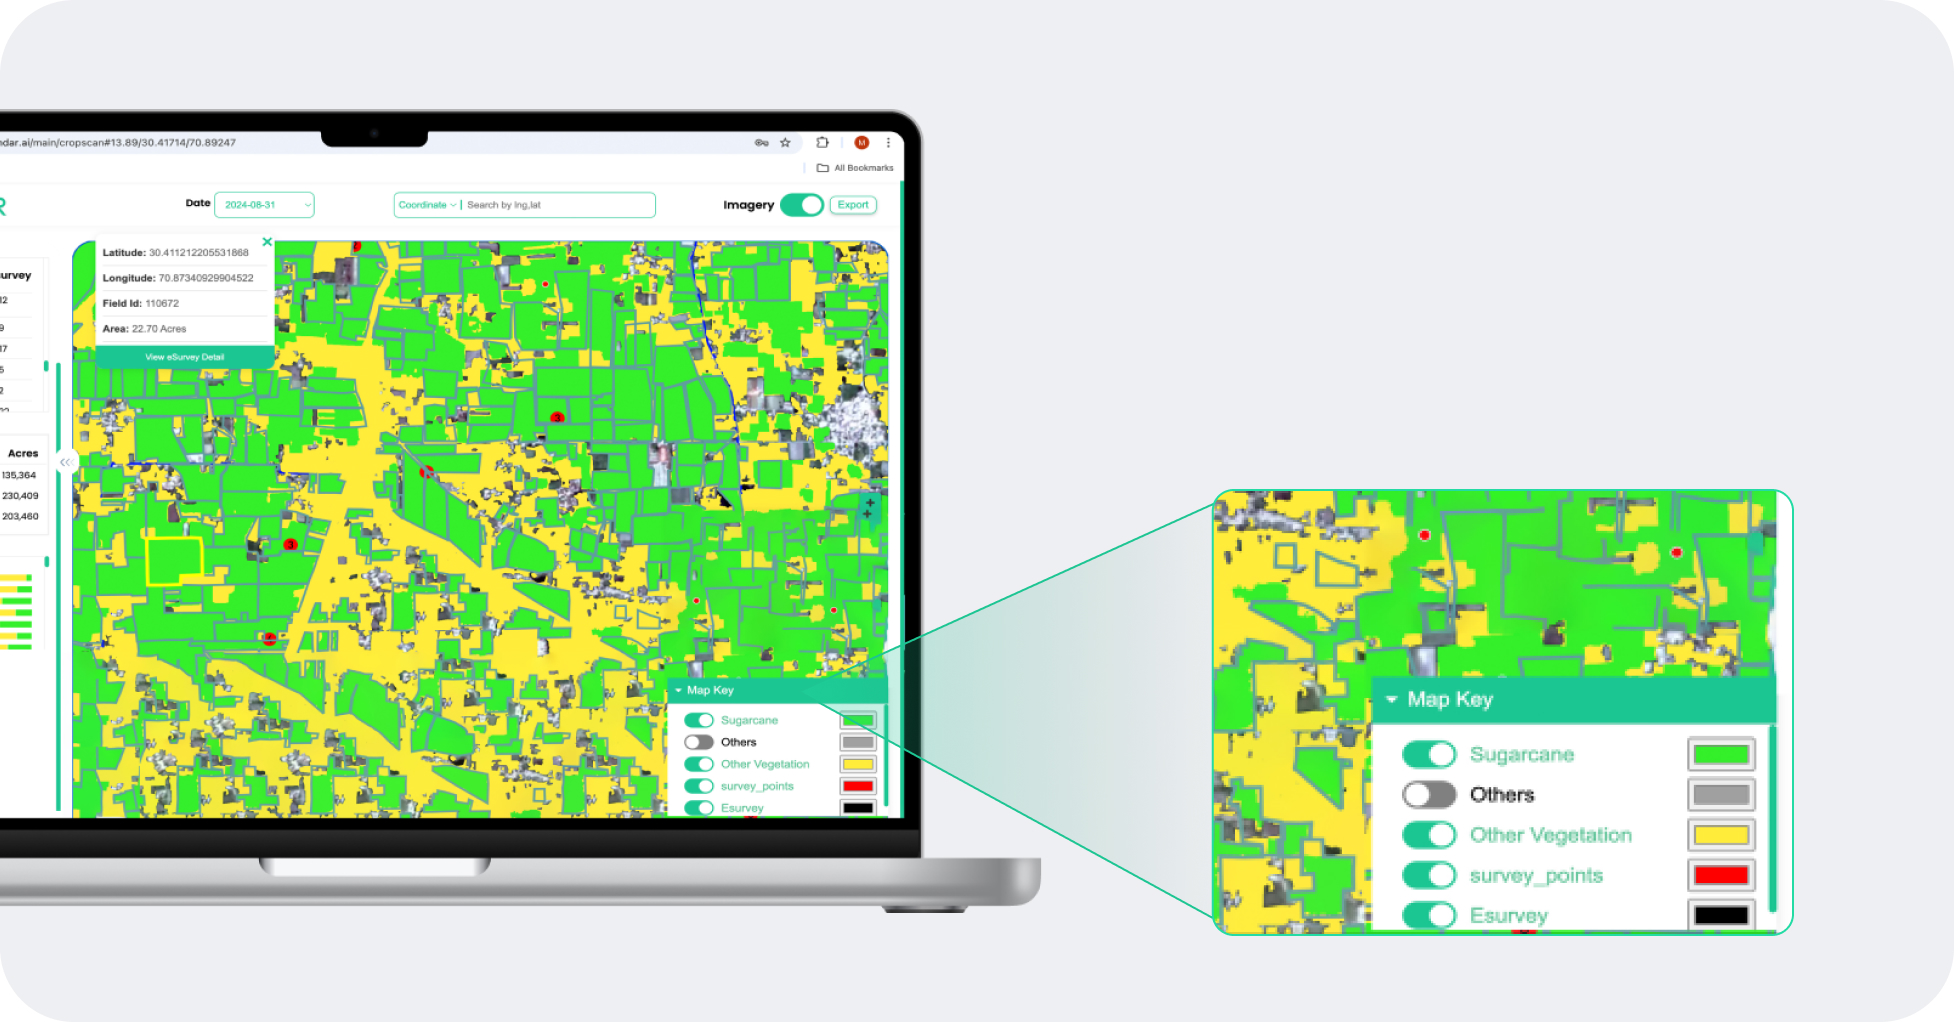
Crop identification
Crop identification
Crop identification
Crop identification
Crop identification
Crop identification
Crop identification
Crop identification
80% - 95% accuracy
Visualised by country, state, province, districts or customised zones & territories

.png)
.svg)
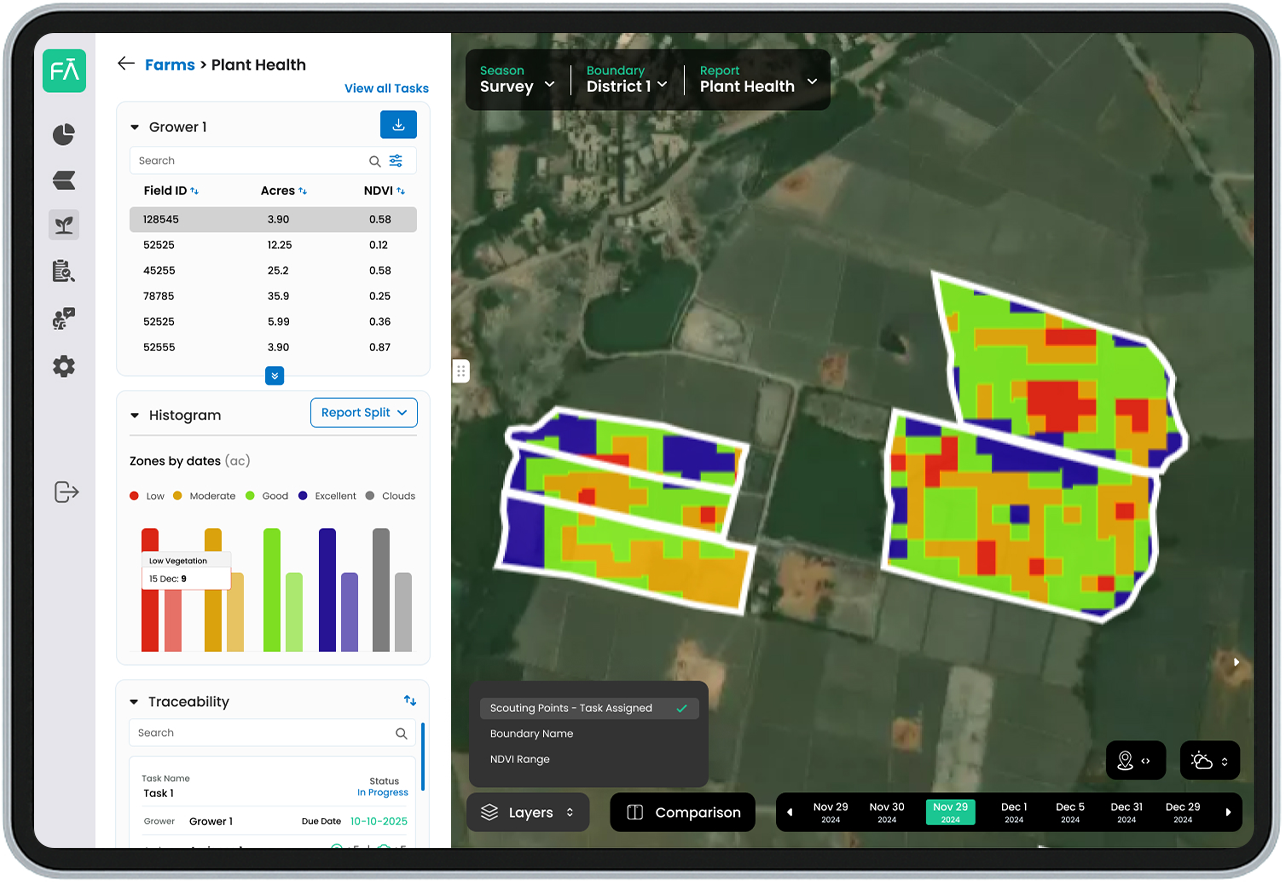
Identify areas of good and poor plant health
Focus efforts on specific areas rather than a blanket approach
Track and improve health of crops resulting in better quality and yields
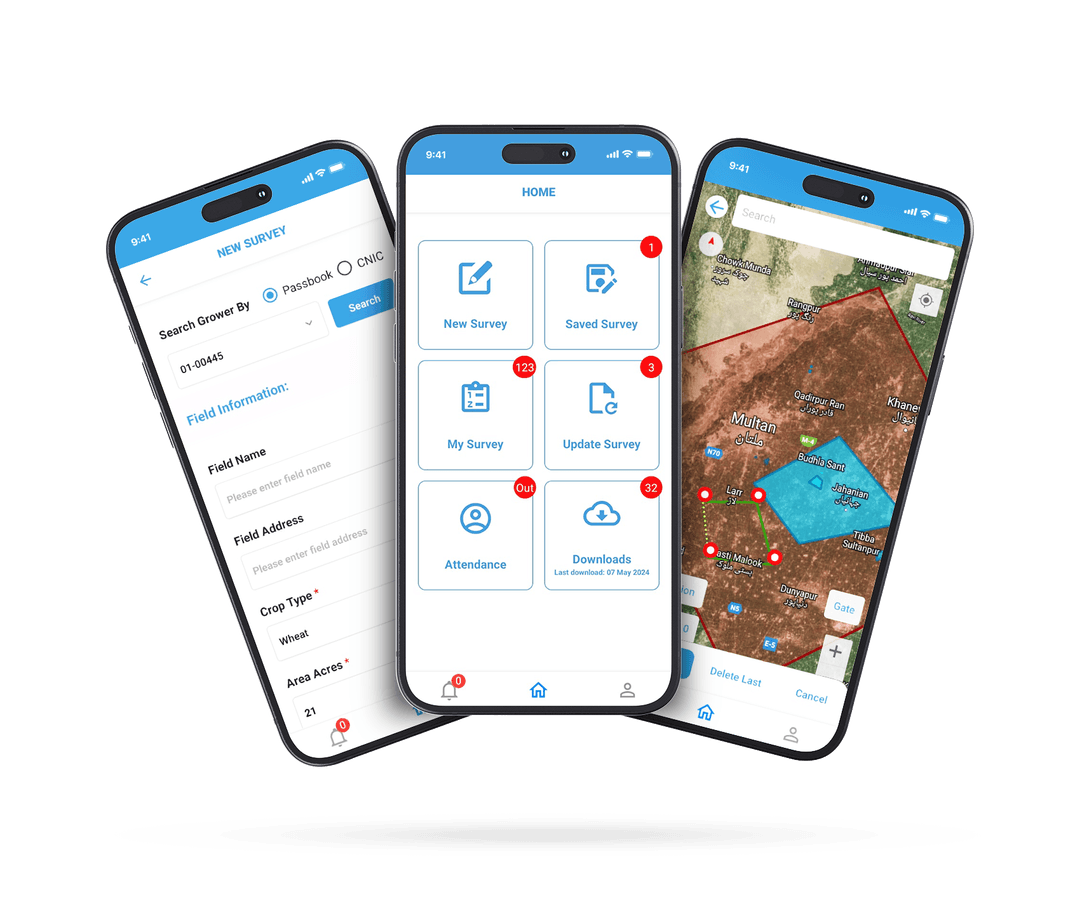
Remote monitoring of farms
Identify which crops are under stress and which ones are likely to be under stress in the future
Focus efforts on specific areas rather than a blanket approach
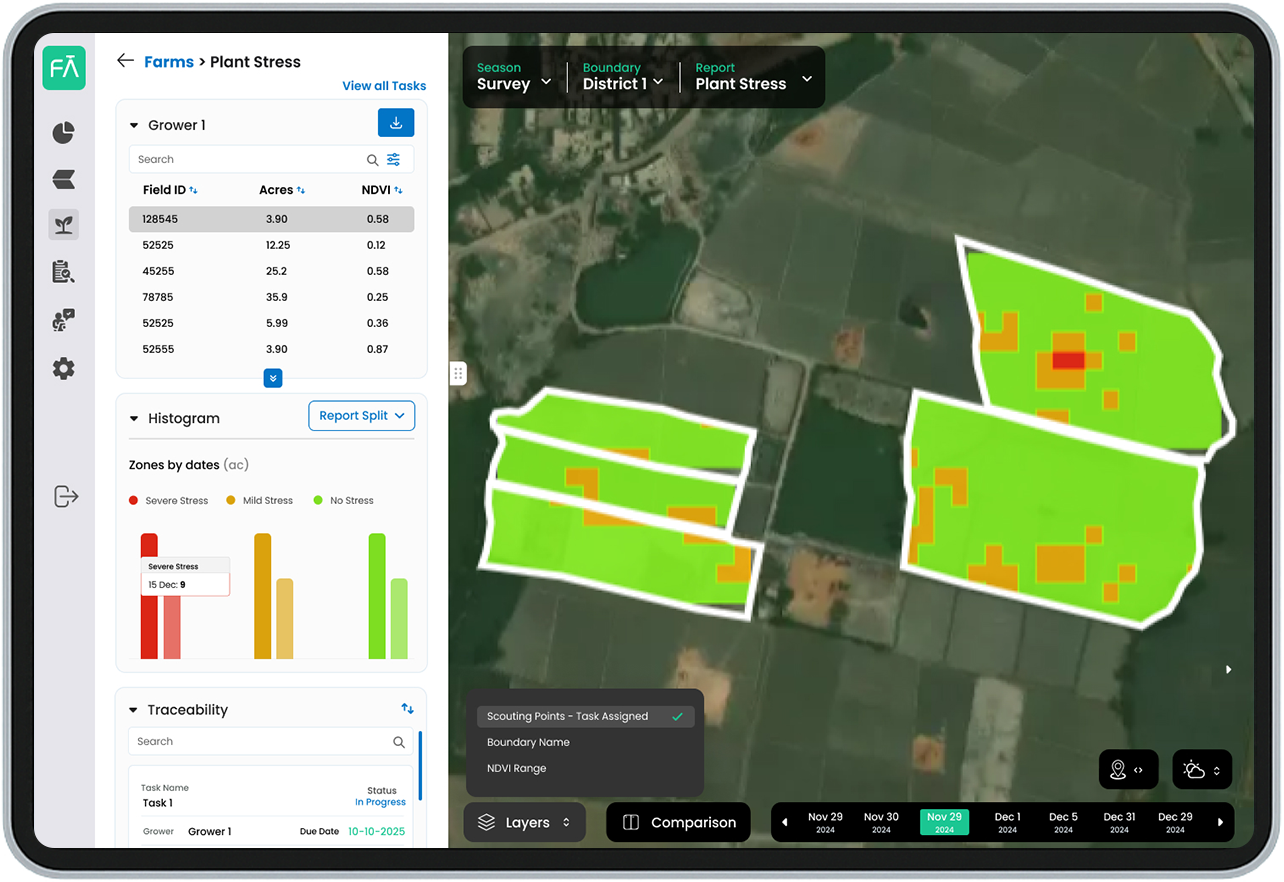
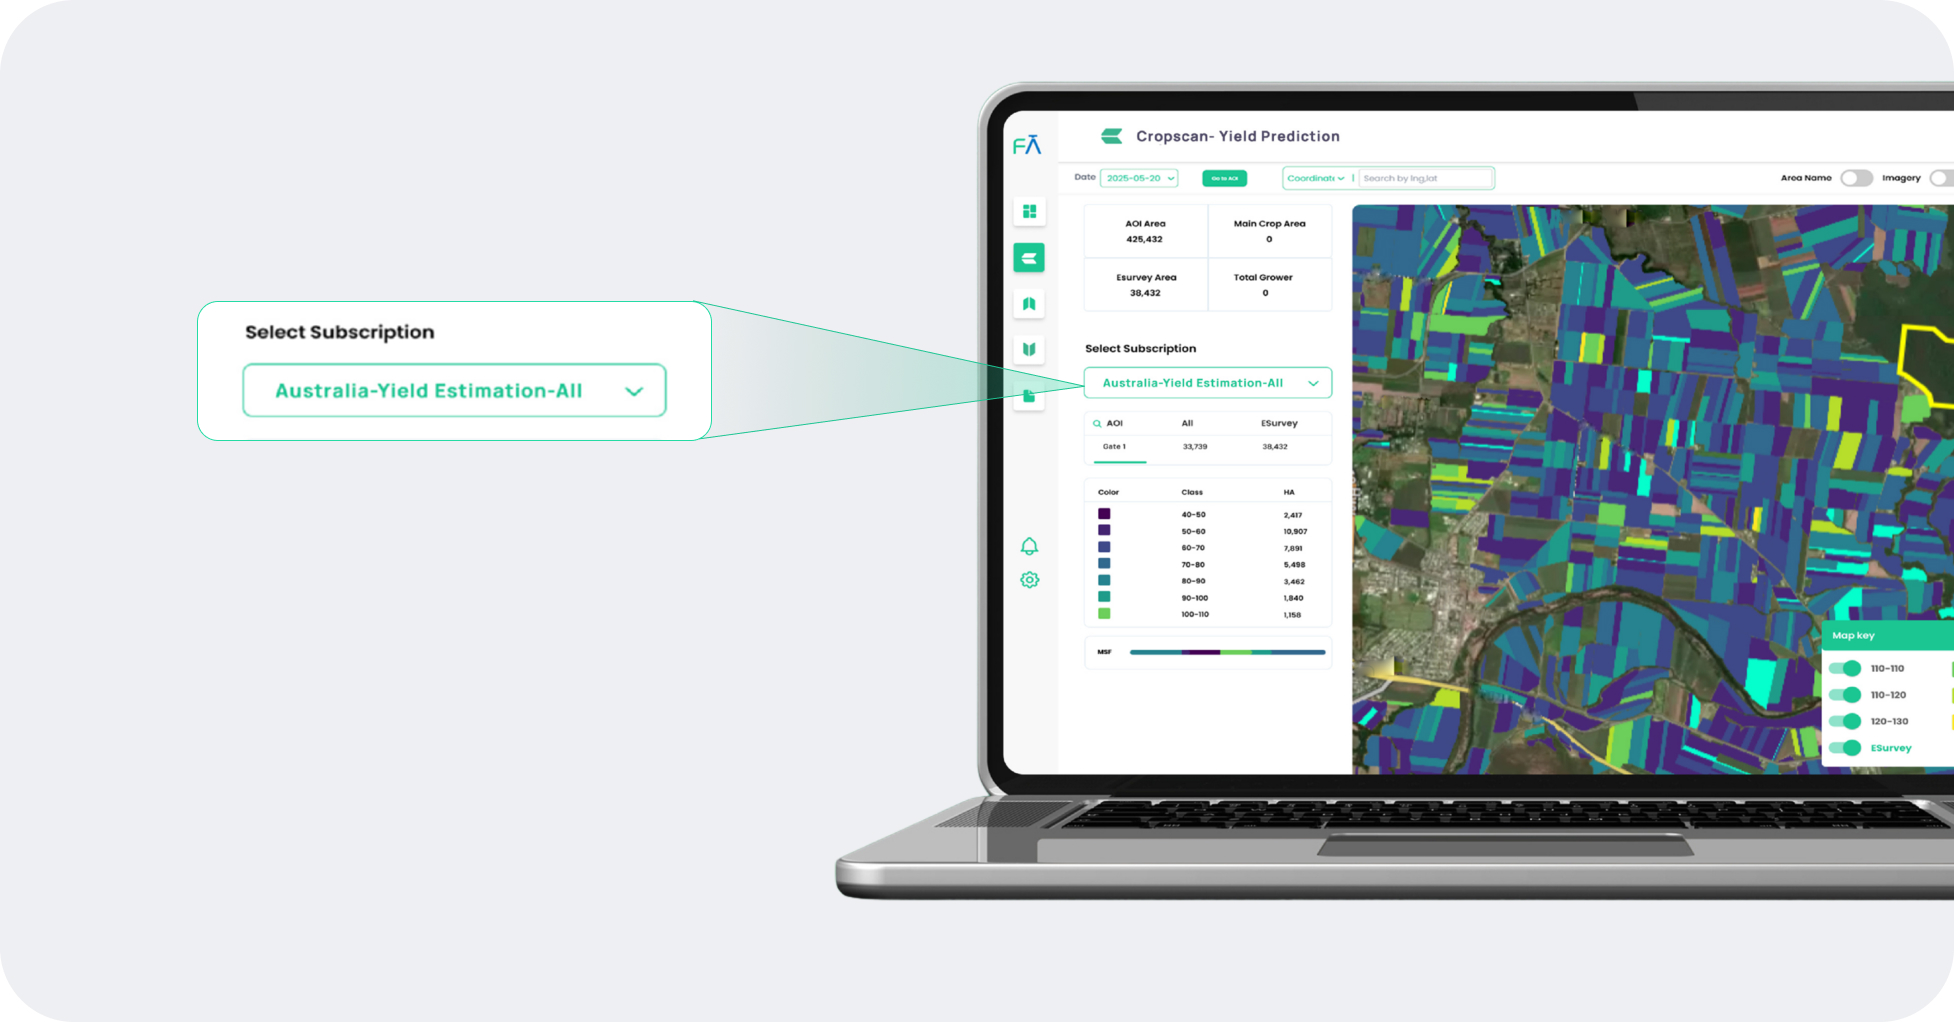
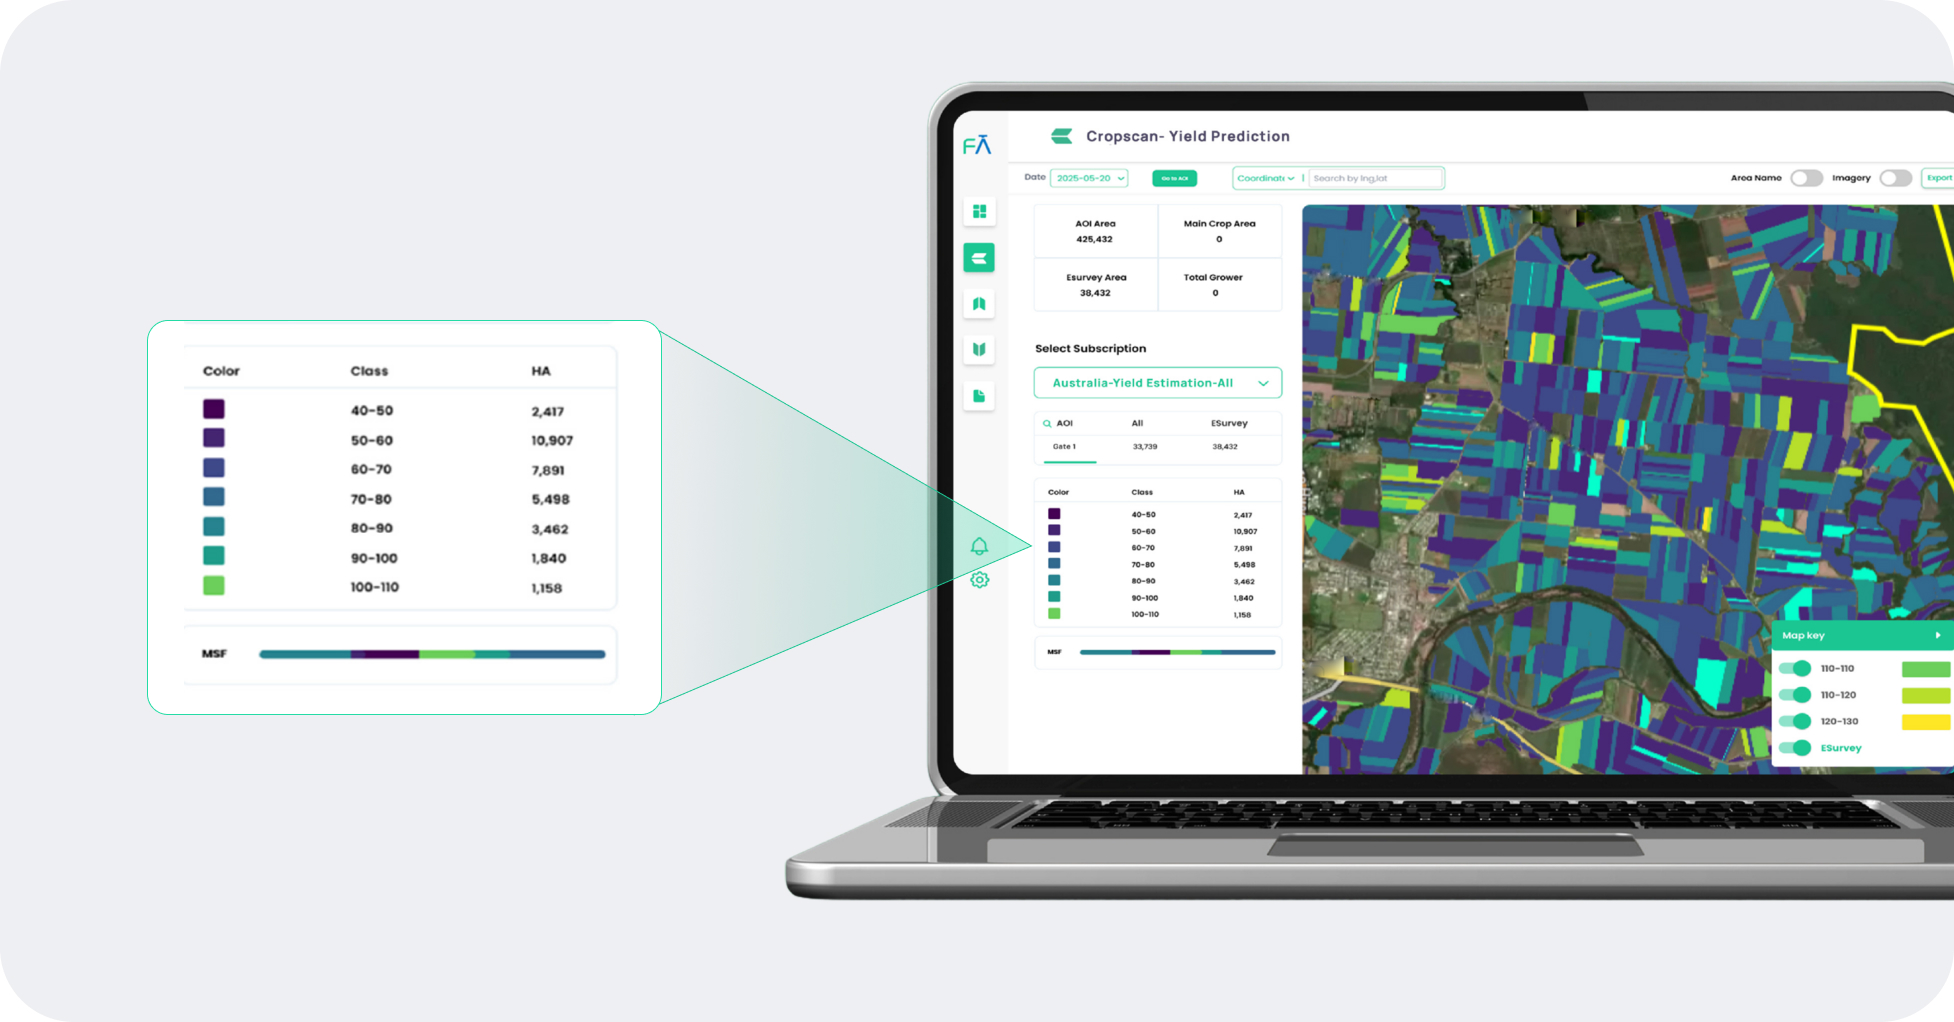
AI-backed using 5-year historical satellite imagery
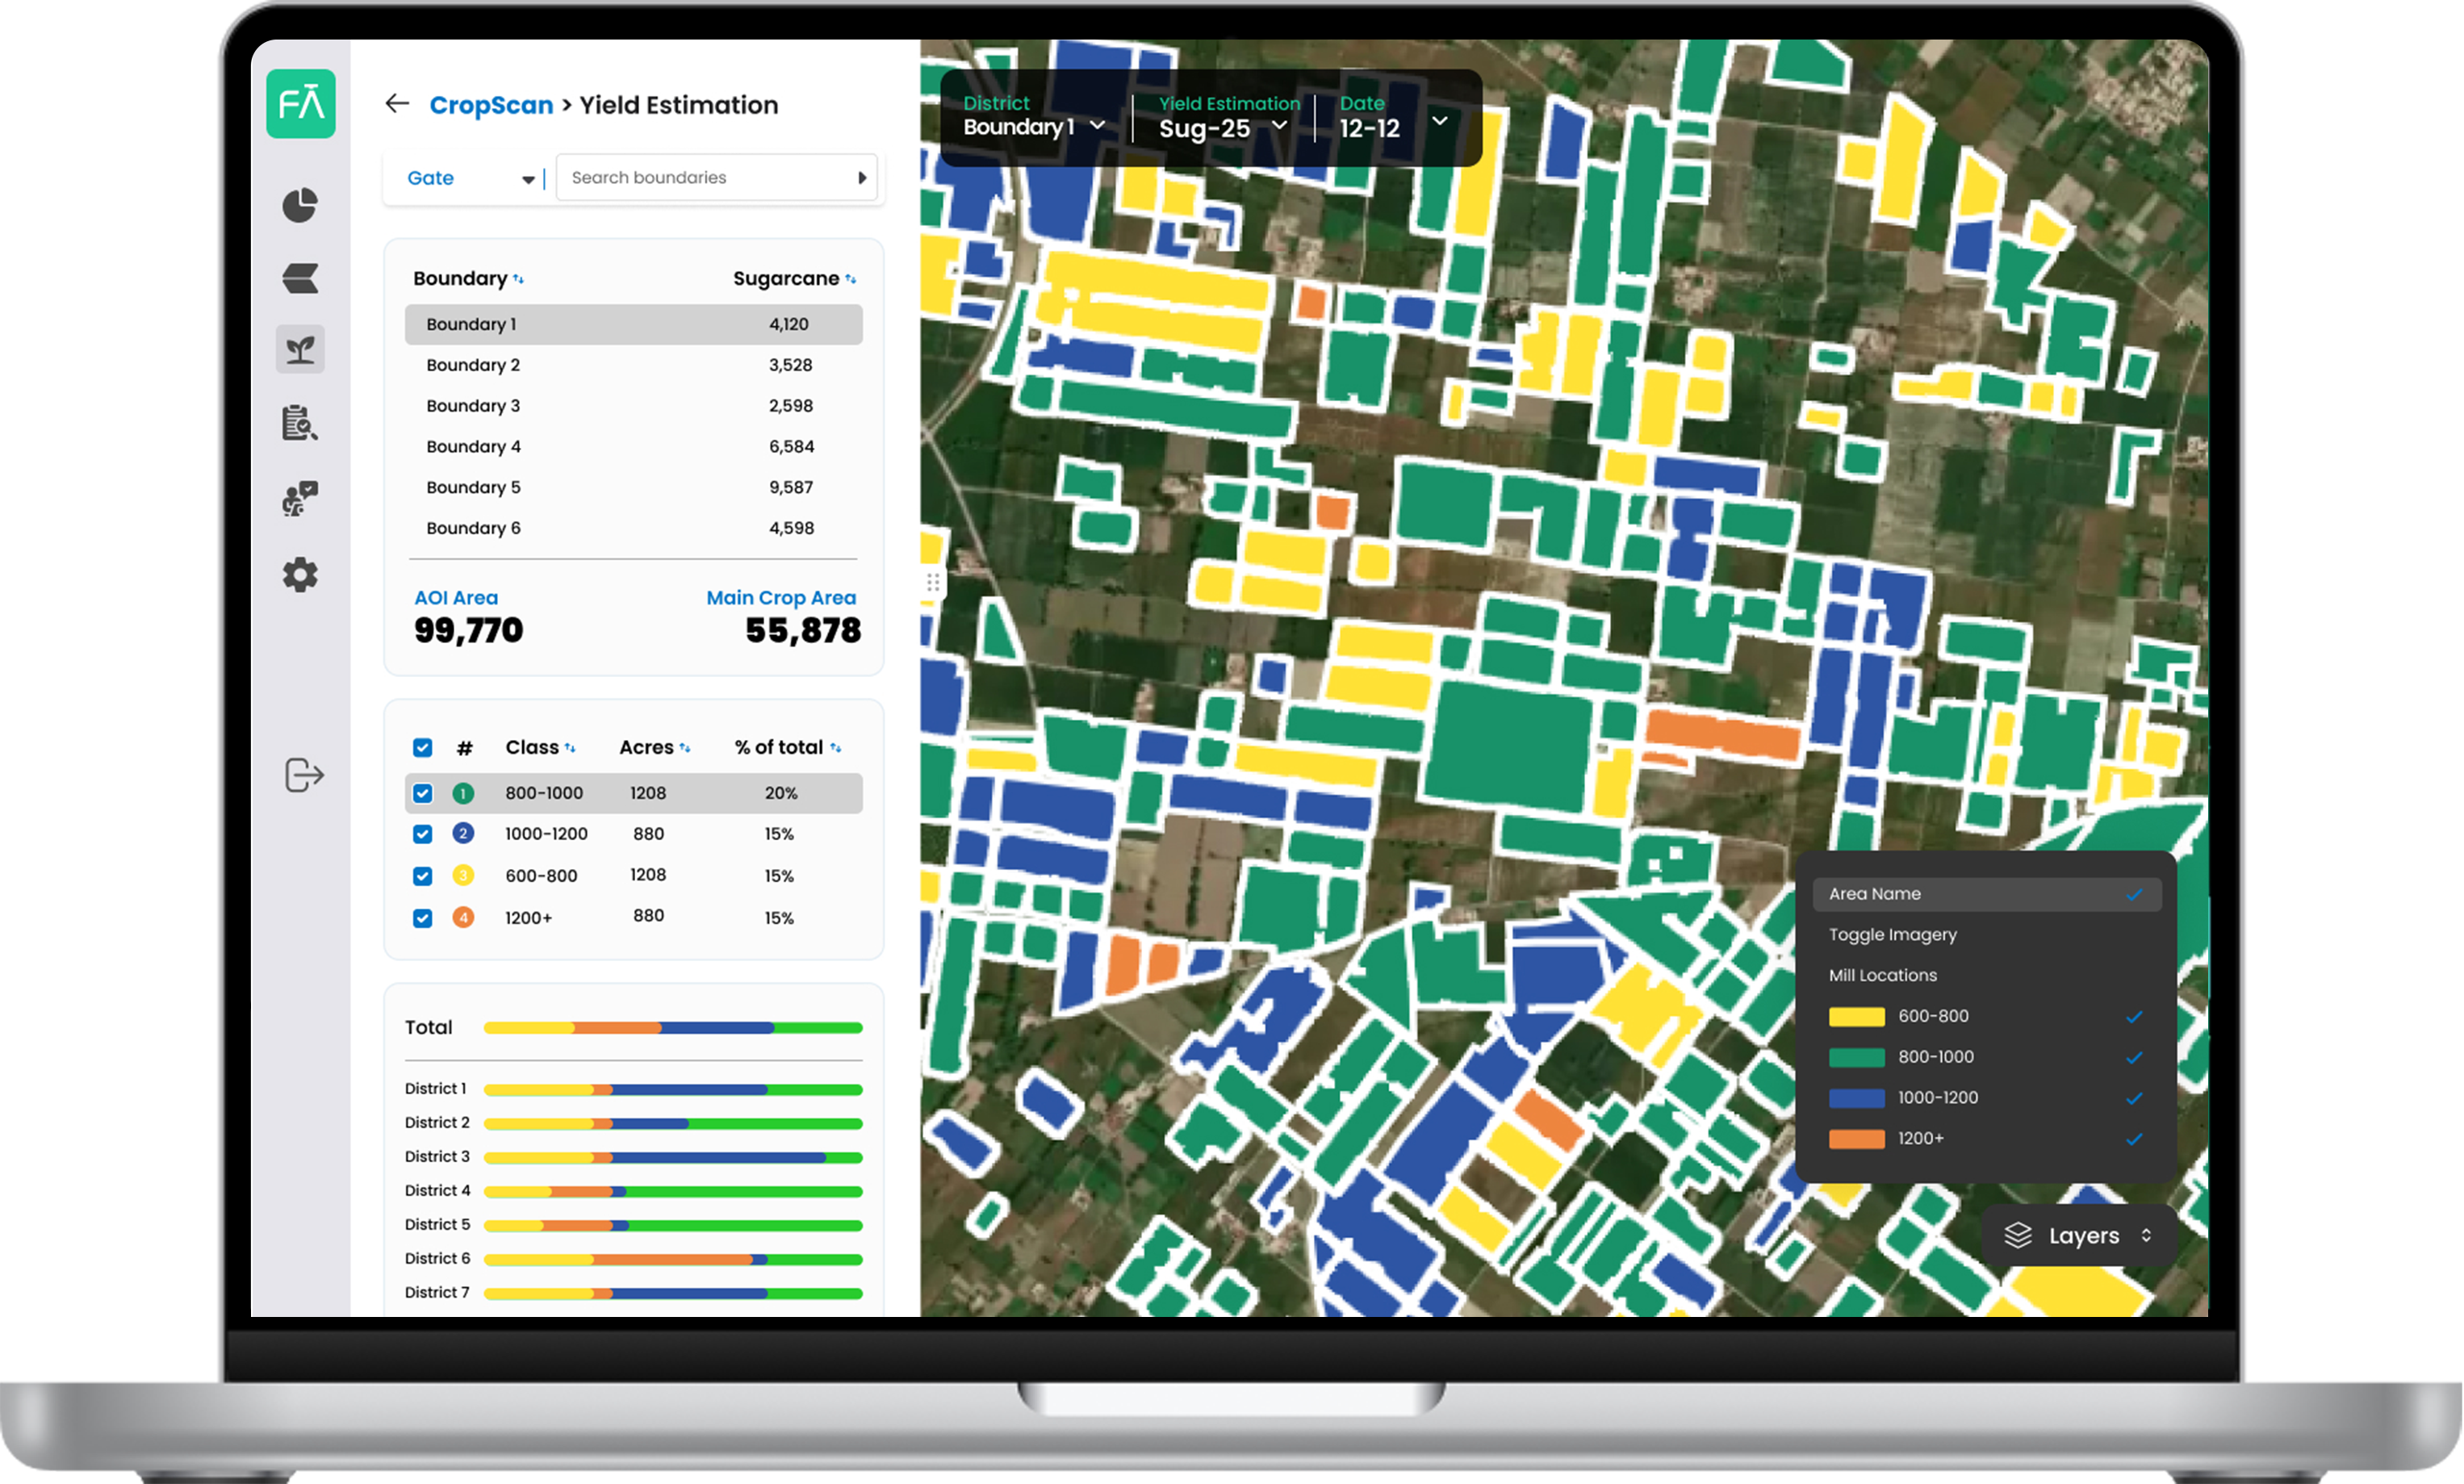
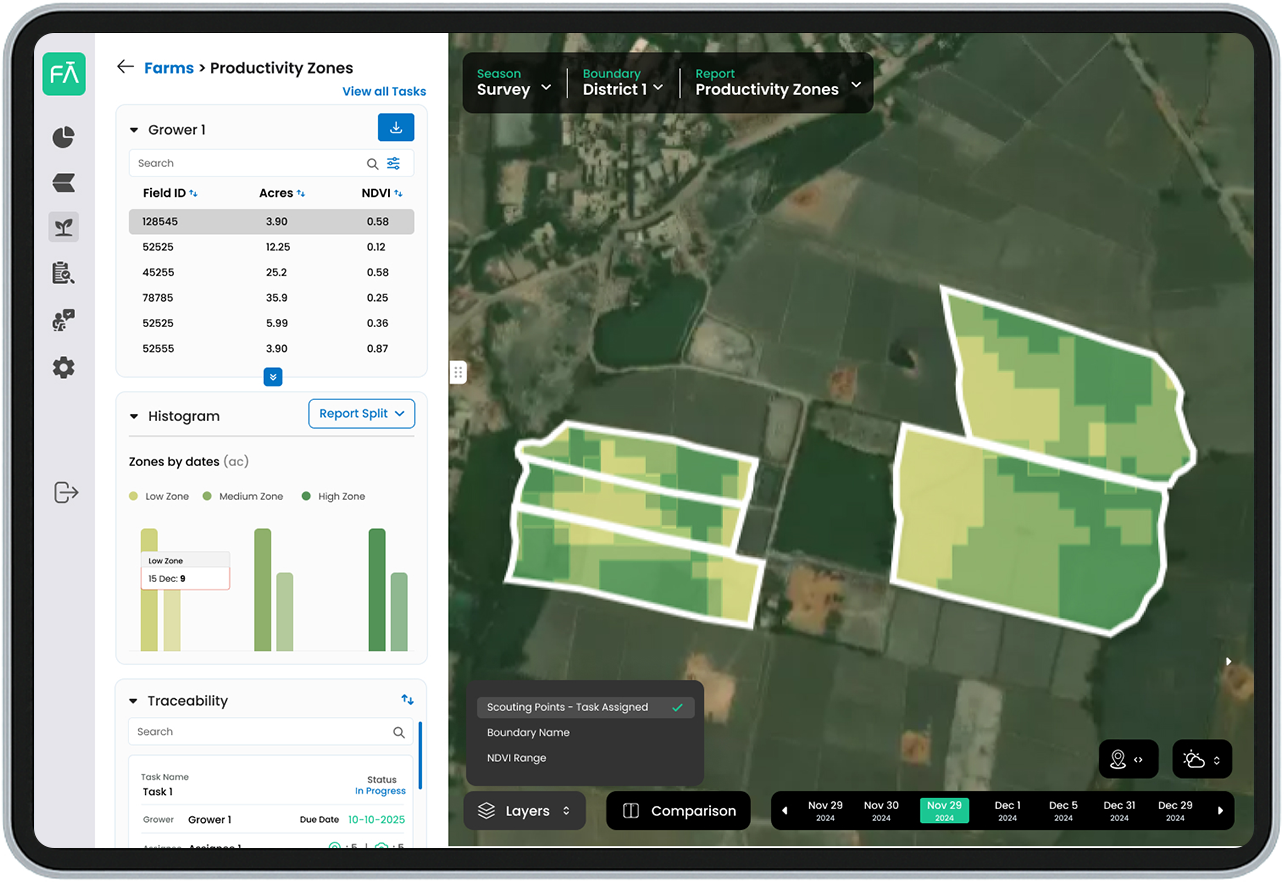
Identifies productivity zones by high, medium and low ranges
Isolate areas for intervention
Select the most productive fields intelligently
Allows farmers to apply P&K intelligently
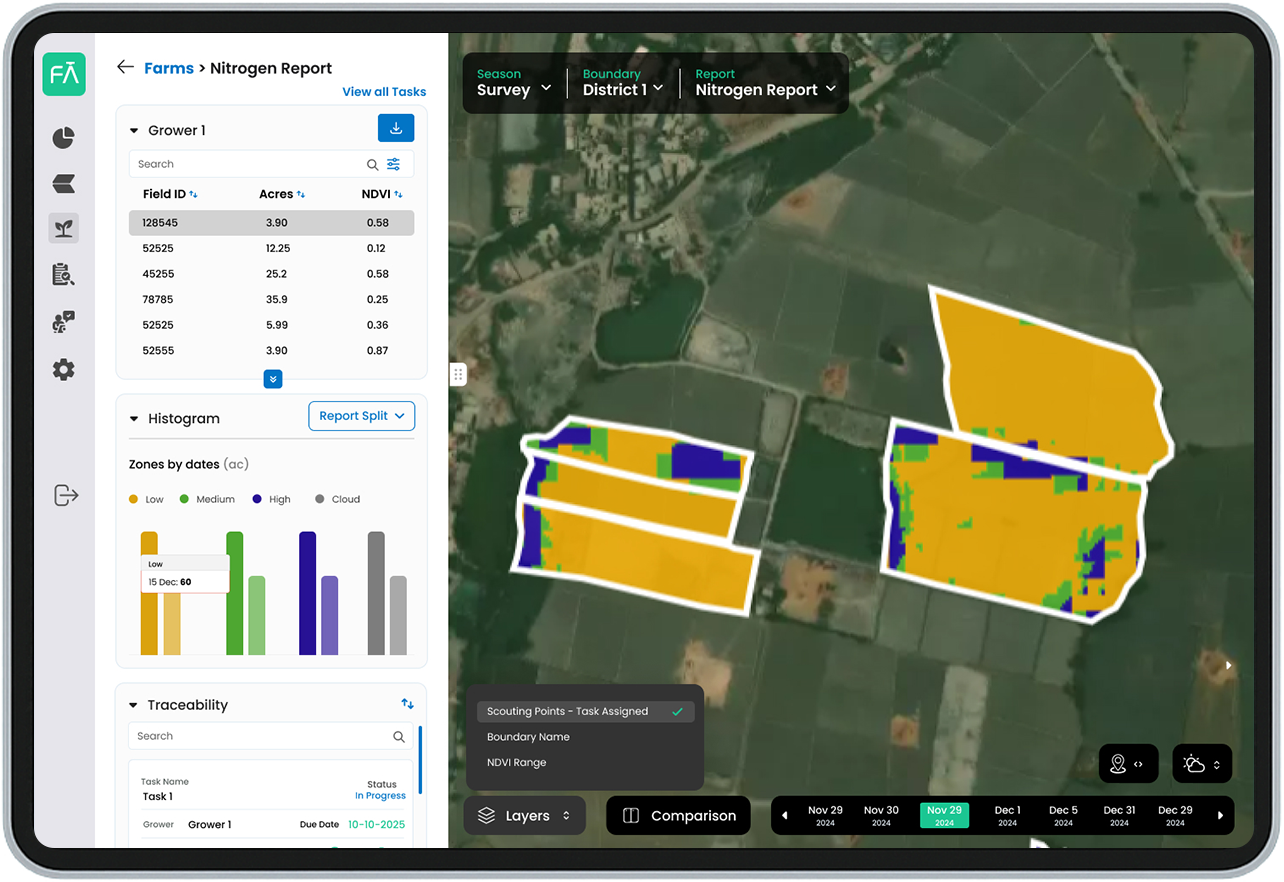
Identify areas of high, medium and low Nitrogen requirement
Based on AI and satellite imagery analysis of plant chlorophyl content
Enables reduction of environmental impact of Nitrogen
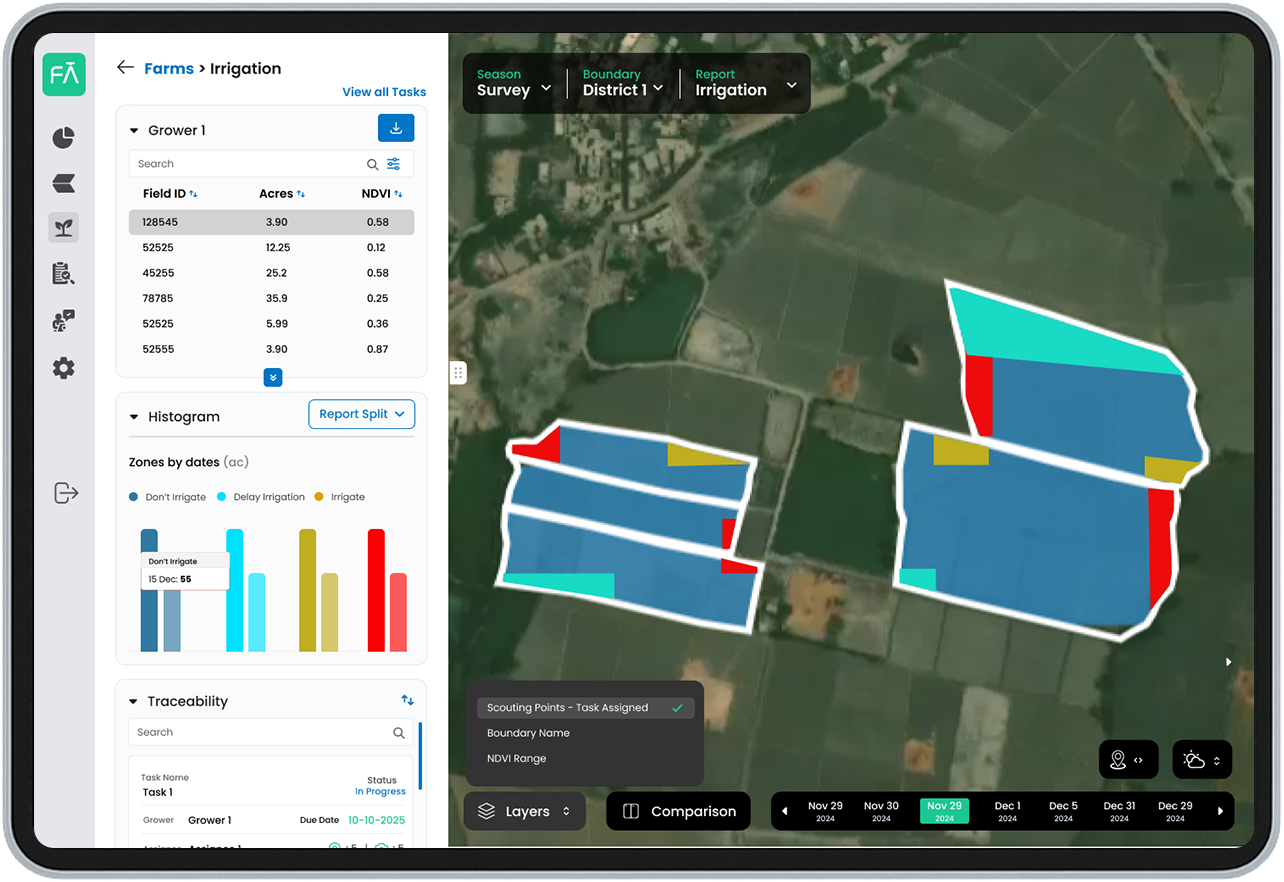
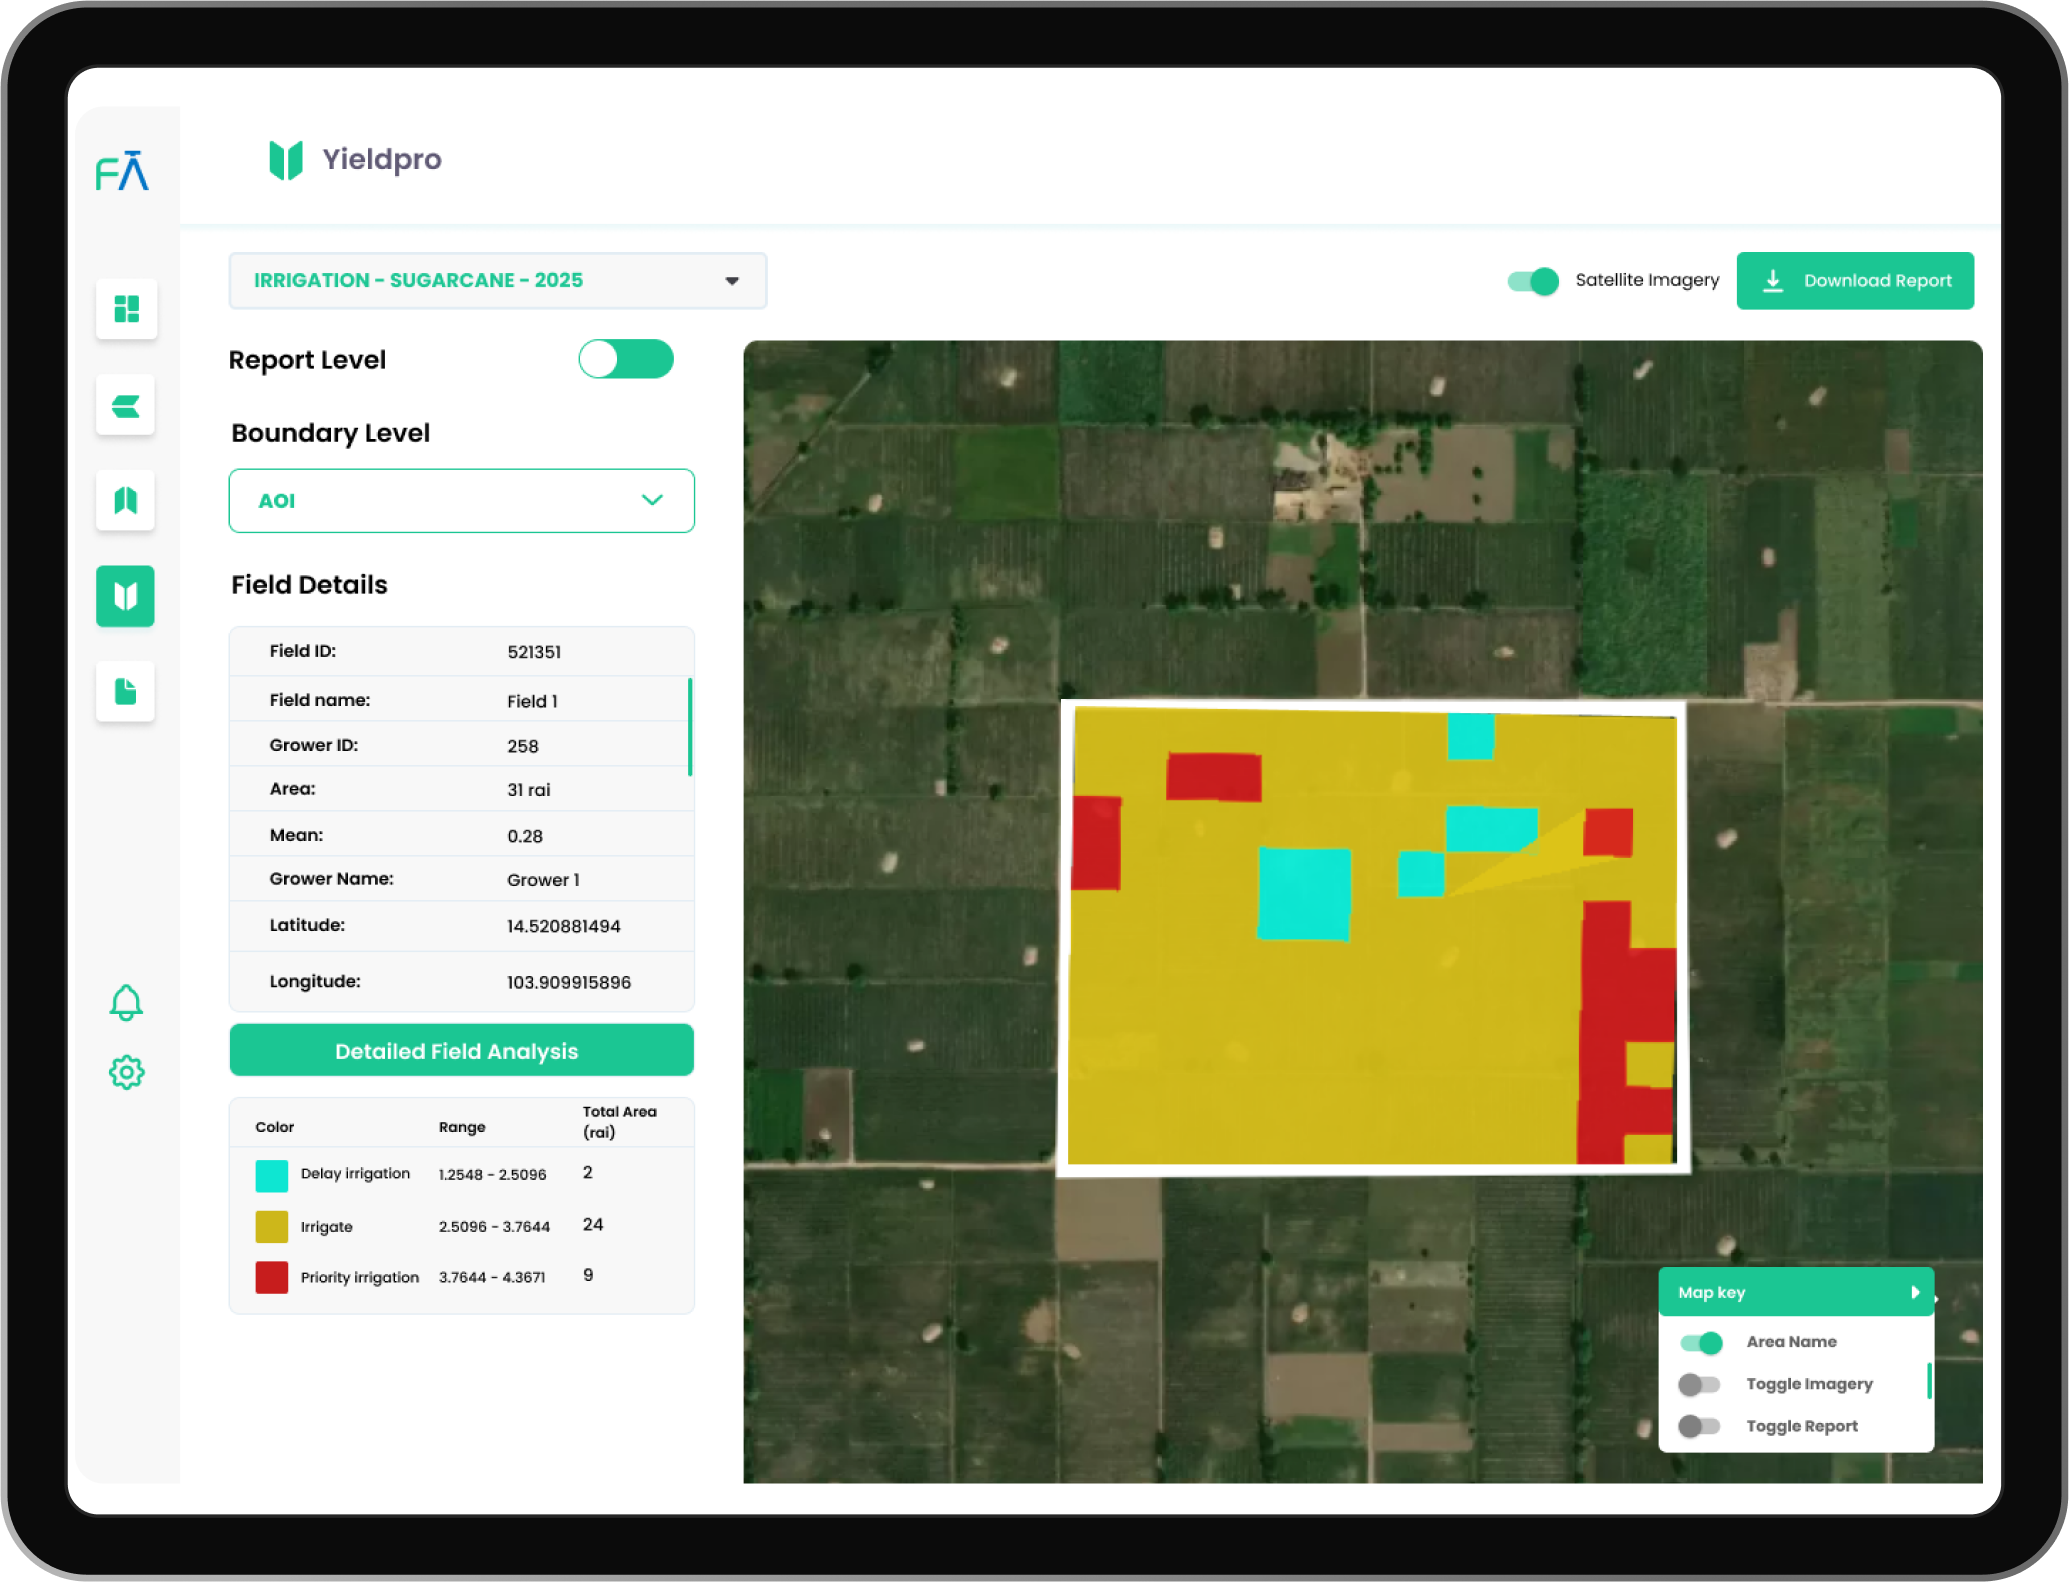
Compares actual vs. potential evapotranspiration using space data
Prevents overwatering
Enables precise irrigation, reduces water waste, and protects yield
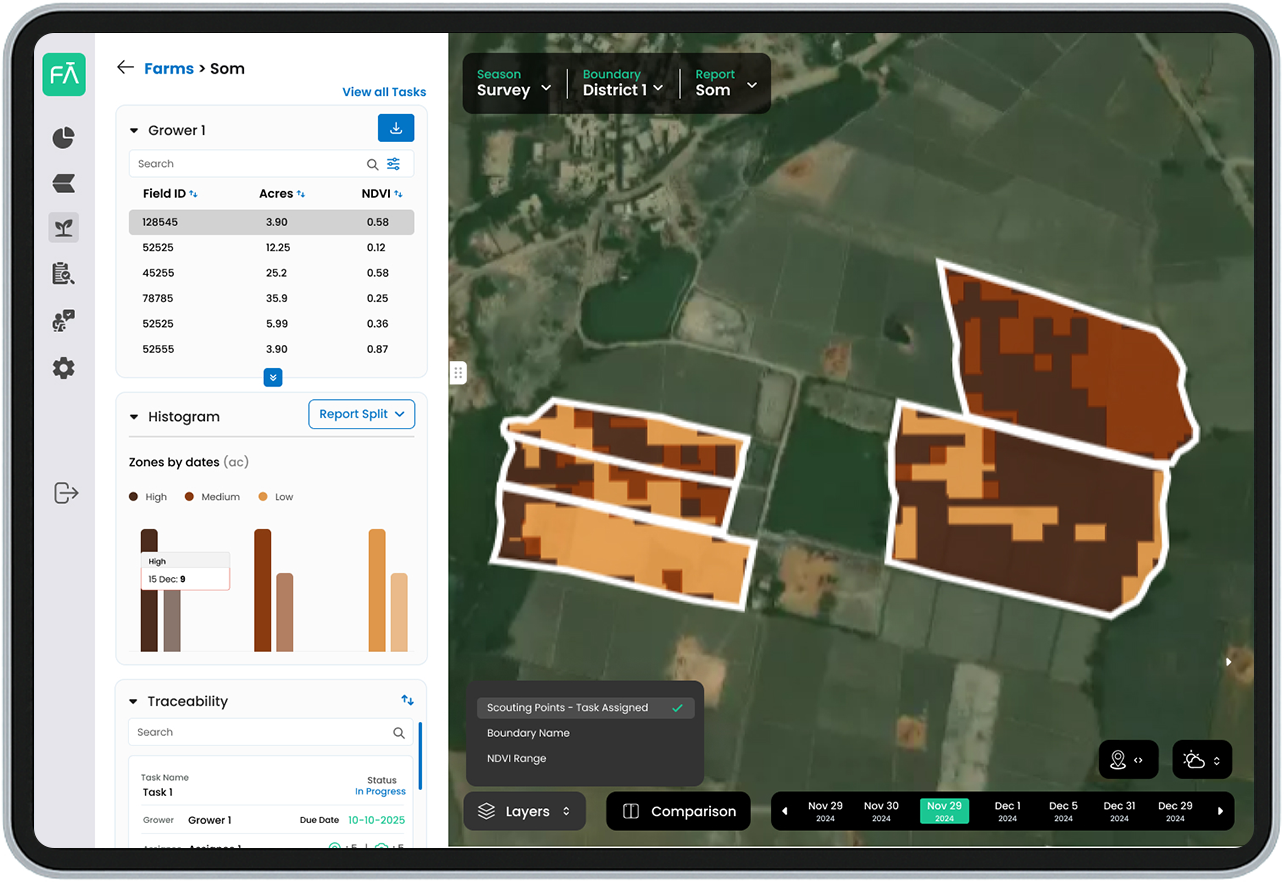
In the SOM analysis, black represents areas where organic matter is good, while grey and white represents the areas with medium and low organic matter quality
High yield productivity area corresponds with good SOM
Identifying zones of low, medium and high SOM allows focused areas for soil improvement efforts
.svg)

Customisable, pre-loaded crop development activity calendar, with task assignment, scheduling and audit for field managers:
Identify areas of good and poor plant health
Assign tasks to field staff employees for each sector, and track the status of each task
Integrate eSurvey data for grower wise monitoring of farming practices from seed-to-harvest
Receive real time grower feedback and surveyor remarks regarding diseases, and pests in specific areas to flag to other growers
Identify which crops are under stress and which ones are likely to be under stress in the future
Focus efforts on specific areas rather than a blanket approach
AI-backed using 5-year historical satellite imagery
Identifies productivity zones by high, medium and low ranges
Isolate areas for intervention
Select the most productive fields intelligently
Allows farmers to apply P&K intelligently
Identify areas of high, medium and low Nitrogen requirement
Based on AI and satellite imagery analysis of plant chlorophyl content
Enables reduction of environmental impact of Nitrogen
Compares actual vs. potential evapotranspiration using space data
Prevents overwatering
Enables precise irrigation, reduces water waste, and protects yield
In the SOM analysis, black represents areas where organic matter is good, while grey and white represents the areas with medium and low organic matter quality
High yield productivity area corresponds with good SOM
Identifying zones of low, medium and high SOM allows focused areas for soil improvement efforts
With Farmdar’s wide depth of products, there are many ways you can optimize your business efficiency, easily and immediately. Request a consultation or book a demo, we look forward to hearing from you.
.png)
.svg)


.svg)
.svg)
.svg)
.svg)